The AI billboard advertising platform is no longer a luxury for Indian brands; it is the only way to survive a market where physical visibility is finite but cognitive attention is increasingly elusive. As the Indian advertising landscape crosses the ₹1.11 lakh crore threshold in 2026, the out-of-home (OOH) sector has reached a critical inflection point where gut feel is being replaced by mathematical proof. This shift represents a move toward standardized, defensible evaluation logic in a market that has historically operated on personal relationships and opaque pricing models.
The current state of outdoor advertising in India is a paradox of high growth and low accountability. While OOH is the only traditional medium projected to grow in absolute rupee terms this year—every other legacy format from print to linear television is contracting—the industry still struggles with a lack of structured decision intelligence. Brands are realizing that a billboard is not just a piece of real estate; it is a coordinate in a behavioral system. In 2025, the OOH AdEx stood at ₹4,724 crore, and the industry is currently expanding at a rate of 12-15% annually. This expansion is fueled by the rapid premiumization of assets and the rise of digital out-of-home (DOOH), which is expected to account for 25% of all outdoor revenue by 2028. For brands like Tata, Axis Bank, and Nestlé, the priority has shifted from simply being "seen" to being "reasoned" into the consumer journey.
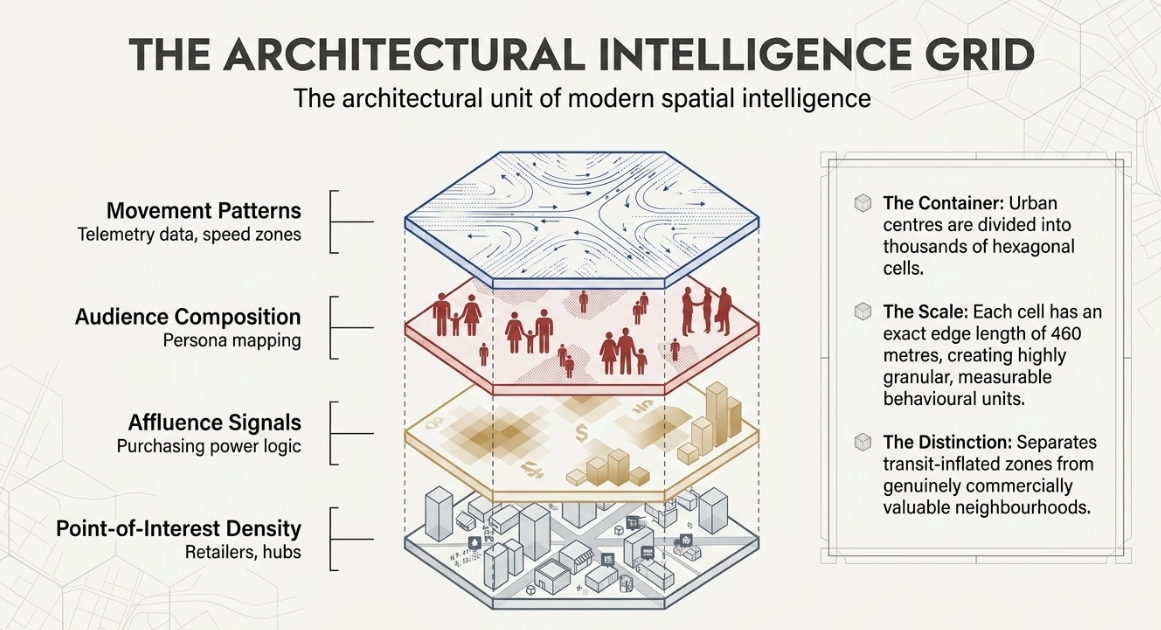
Defining the spatial intelligence architecture
The foundational shift in modern outdoor advertising is the move from site-first planning to city-first modeling. In the traditional model, a media planner begins with a list of available boards and attempts to retrofit them into a brand brief. ADNOXY inverts this logic by treating the city as a comprehensive behavioral grid before a single asset is even considered. This spatial intelligence engine functions as a multi-layer reasoning pipeline that models how people move, where they linger, and what they intend to do when they reach their destination.
The technical core of this system is the hexagonal demand model. Instead of using arbitrary administrative boundaries or square grids that create measurement overlap, the platform divides the city into discrete hexagonal cells with an edge length of approximately 460 meters. Every cell serves as a measurable unit containing granular data on movement patterns, point-of-interest (POI) density, and audience composition. This indexing allows for a standardized evaluation of any physical location, similar to how a credit rating agency provides a neutral framework for evaluating financial risk.
Within this architecture, every billboard inherits its strategic value from the hexagonal cell it occupies. The engine calculates value through four primary scoring dimensions: Audience, Movement, Commercial, and Intent. The Audience Score uses "quantum profiling" to map the affluence and persona of the commuters passing through a hex, distinguishing between a student-heavy zone and a premium corporate corridor. The Movement Score rewards locations that provide dwell time and repeat exposure rather than raw traffic throughput. This distinction is vital because it corrects the industry's longest-running assumption: that a high-traffic flyover is always better than a slower-moving arterial road.
The Commercial Score models the purchase environment surrounding the location, identifying whether a zone is a luxury residential belt or a high-frequency transit point. Finally, the Intent Score evaluates whether a specific zone aligns with the brand's archetype. For example, an FMCG brand prioritizing mass reach will weight transit corridors differently than a luxury watch brand targeting corporate decision-makers in Mumbai's Bandra-Kurla Complex. This isn't just about data; it is about building a decision system where every media rupee is auditable.
The failure of gut feel and the flyover paradox
The problem with current OOH media planning in India is that it remains dominated by the supply side. Locations enter media plans primarily because a vendor has a relationship with an agency or because a board happens to be vacant. This leads to a situation where two different agencies can take the same client brief and the same budget, yet produce two completely different plans with no neutral way to determine which is structurally better. Decisions are rarely auditable. When a brand runs a Meta campaign, they can audit every rupee spent; when they run OOH, they often receive a site list, some vague traffic estimates, and a justification that the location is "premium" or "near a mall".
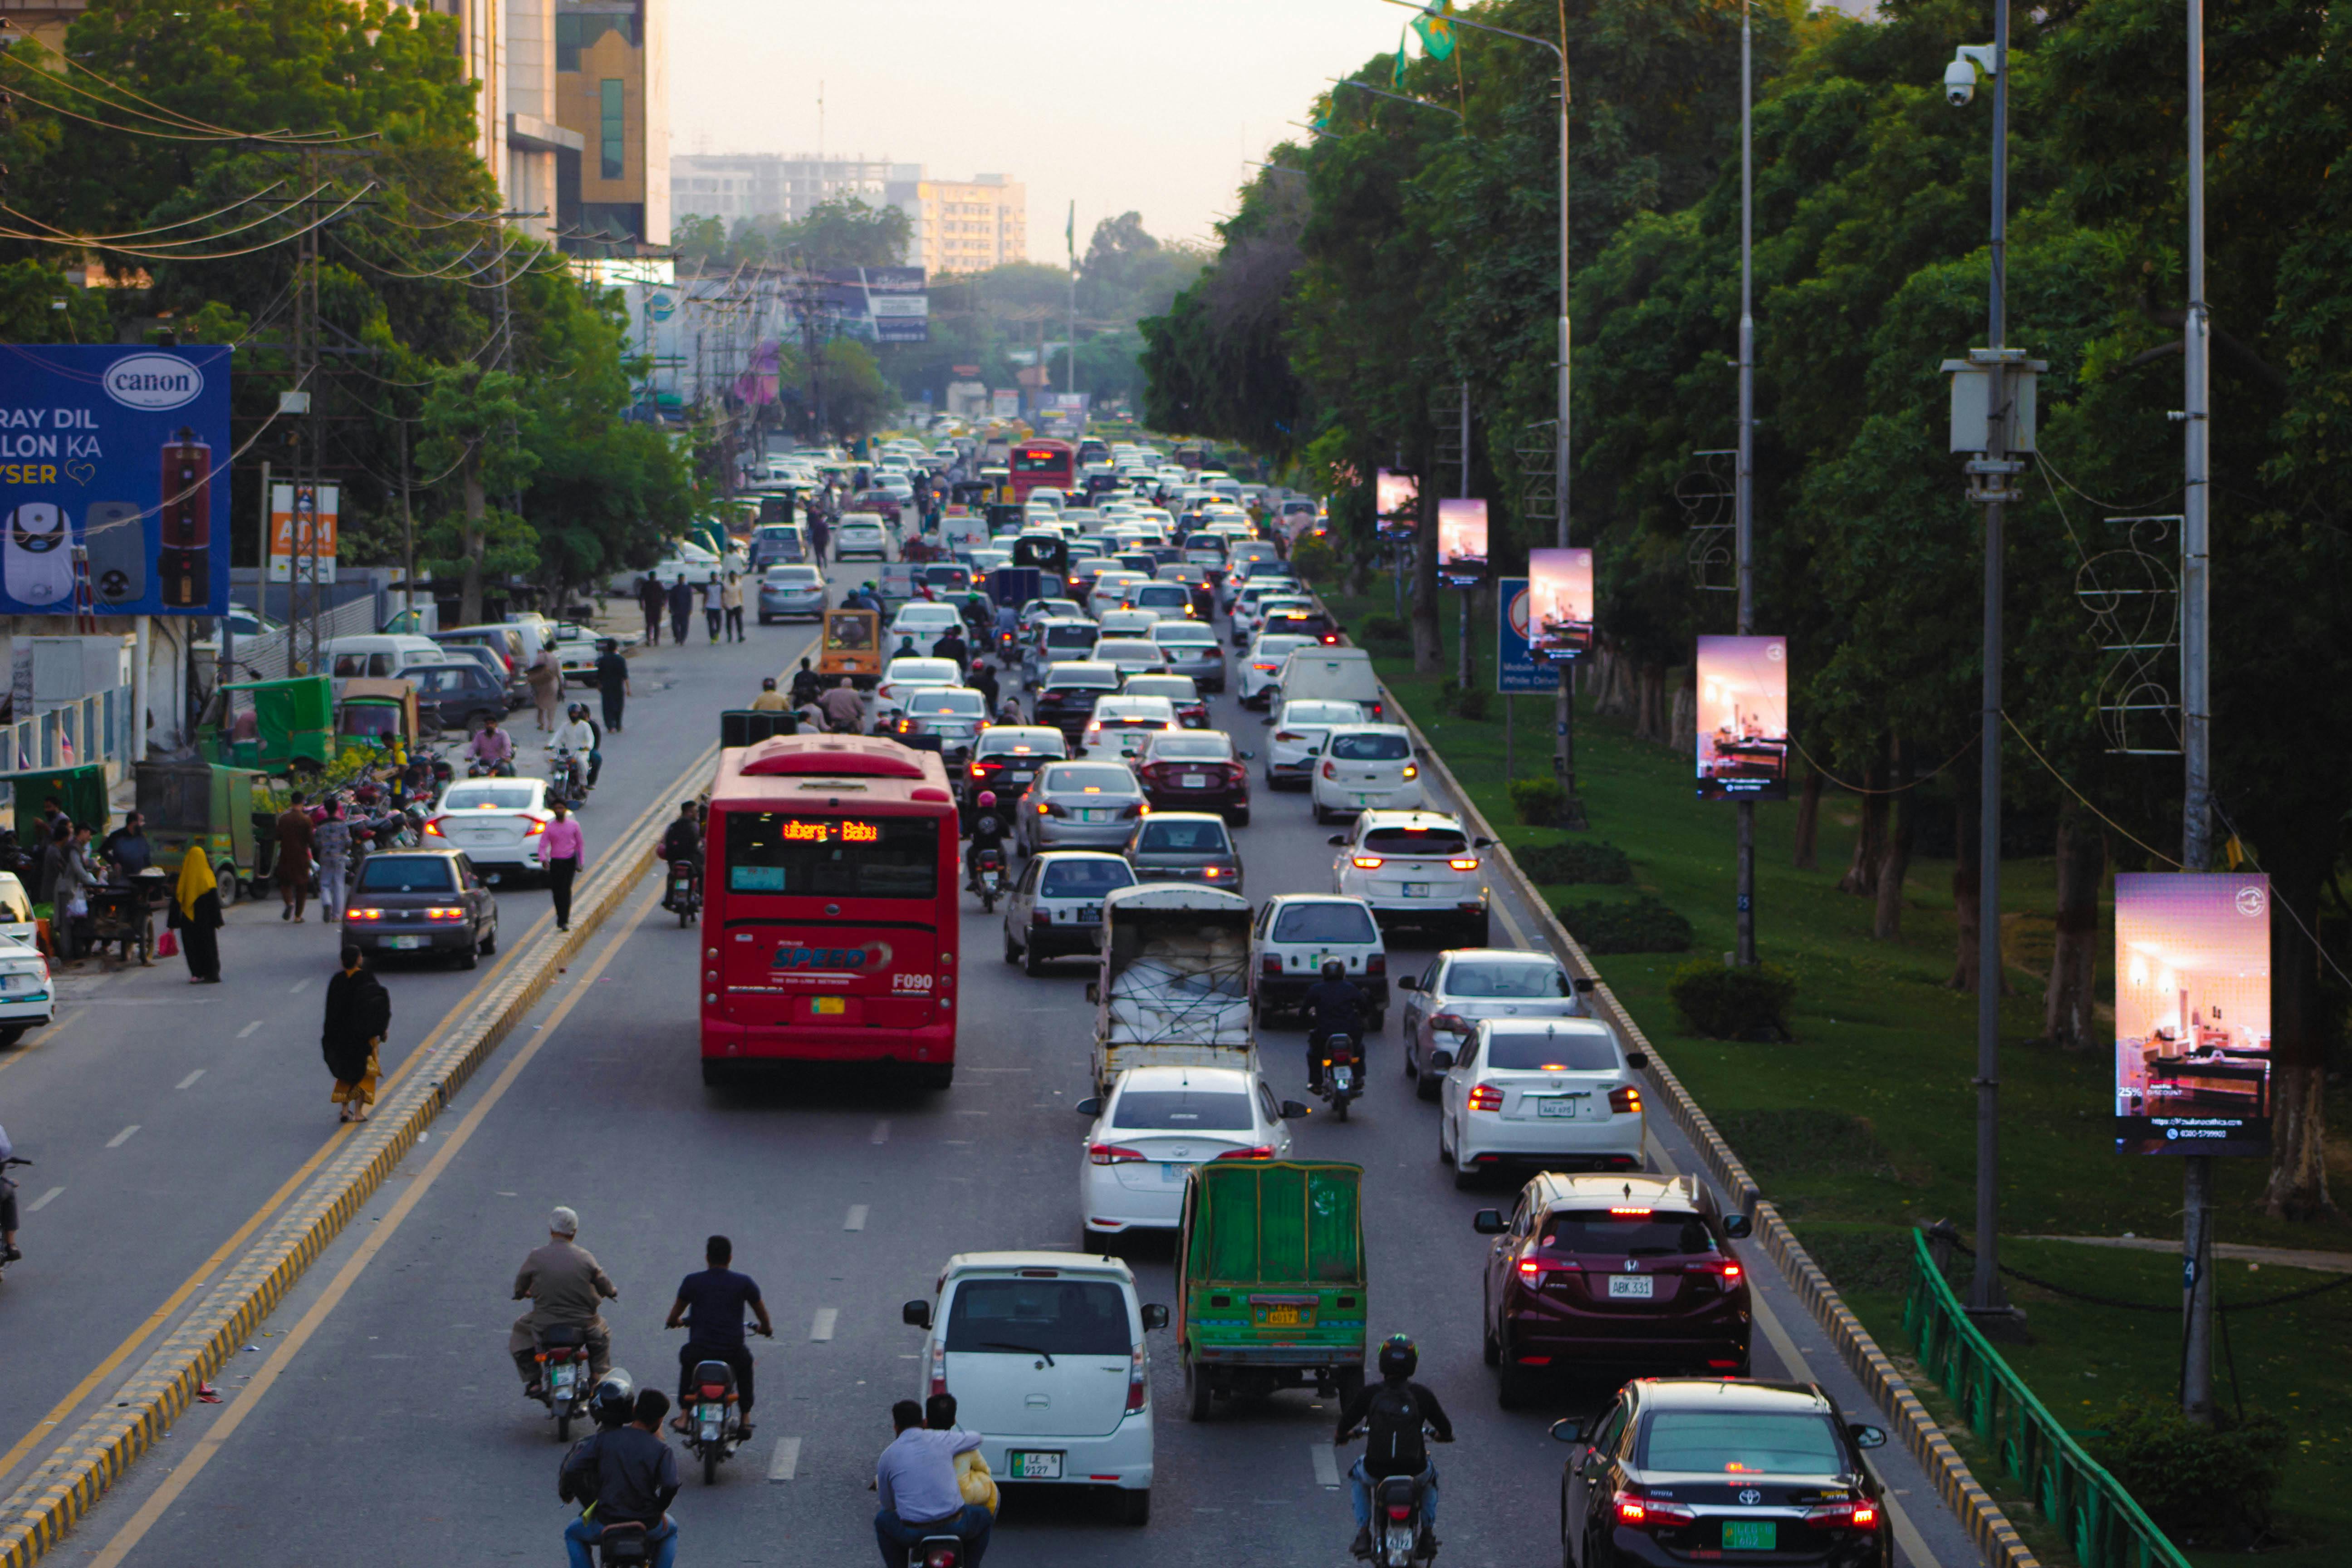
To illustrate this, let’s look at a real-world scenario involving Mumbai's Western Express Highway (WEH). A brand aiming for mass visibility often defaults to the Bandra-Andheri stretch, which carries over 4 to 5 lakh vehicles daily. On paper, the impressions are massive. However, an analysis through an AI billboard advertising platform would reveal that much of this throughput is on fast-moving flyovers. A commuter driving at 60 km/h has less than three seconds of visual engagement with a billboard before it passes their field of vision. If they are focused on navigating traffic or changing lanes, the recall for that hoarding drops to near zero.
Compare this to a neighborhood arterial road with moderate traffic but frequent signalized junctions. In areas like Bengaluru's Richmond Circle, commuters are often stationary for 30 to 60 seconds. During this "dwell time," the brain is in a state of passive search, making it far more likely to encode the brand message. The high-traffic flyover is an impression pipe; the arterial road is a memory engine. Most planners still do not know this. They continue to chase the vanity of raw traffic numbers while ignoring the biological constraints of human attention.
To be direct about something most platforms won't say—full attribution for a static hoarding in a tier-3 city like Meerut or Ranchi is still genuinely difficult. Data in these emerging markets is often fragmented, and anyone selling you a complete, real-time solution for that specific problem is oversimplifying the complexity of the Indian physical landscape. The goal of spatial intelligence is not to promise perfect tracking where it doesn't exist, but to introduce a level of defensible reasoning that mitigates the risk of "blind buying."
How ADNOXY introduces reasoning to media buying
ADNOXY operates at two levels simultaneously to bridge the gap between present media planning and future intelligence. Level 1 is the functional marketplace: it handles the proposals, the inventory sourcing, and the execution workflows that brands need today. But Level 2 is the actual company: a spatial reasoning engine capable of modeling movement behavior and scoring locations with scientific rigor. We built this to move the industry from "what is available" to "what is required."
When we first built the hexagonal scoring model, the question we kept getting from clients wasn't "how accurate is it?" — it was "can you show me which zones my competitor is not covering?" That question changed how we think about the entire platform. We realized that planners don't just want a list of boards; they want a strategic map of the city’s mental real estate. They want to know where they can achieve "corridor dominance."
The system classifies every billboard into specific strategic roles rather than just sizes or prices. A site might be a PRIMARY_ANCHOR, which creates authority in a business district, or a COMMUTE_FREQUENCY_DRIVER, designed to build memory through repetition along a daily office route. By treating roads as behavioral systems rather than simple transit pipes, ADNOXY enables "exposure sequencing." This is the process where a brand appears multiple times in a single journey, creating a cumulative memory effect that a single, isolated placement cannot replicate.
This approach transforms the OOH plan from a PDF of photos into a structured media strategy. For every location, the system produces a strategic explanation—not just a score. This allows a media planner to sit in a client meeting and explain exactly why a site on the BKC Connector is more valuable than a larger board on the Amar Mahal Flyover, even if the latter has higher traffic. It introduces the concept of "location reasoning" into a market that has lived on intuition for too long.
Explore the full platform at adnoxy.com.
Standardizing the AI billboard advertising platform through Data and Proof
The transition to an intelligence-led model is backed by hard numbers that reflect the shifting reality of the Indian consumer. In 2026, the outdoor sector is the highest-performing channel for ad recall. According to data from Nielsen India, OOH delivers an 82% recall rate—significantly higher than the 62% for television and the 41% for digital display ads. This effectiveness stems from the medium's non-skippable nature; you cannot block a 40-foot hoarding on the DND Flyway in Delhi.
The scale of the ADNOXY engine allows it to analyze 50,000+ billboard locations across the country with a predictive accuracy of 85% for campaign performance. This level of precision is why the platform was featured by Inc42 as one of India's Top 5 AI Startups To Watch in February 2026. For brands, the financial argument is even more compelling when looking at the cost of reach. Traditional hoardings deliver a CPM of ₹5–₹15, which is the lowest of any media channel in India.
| Media Channel |
Ad Recall Rate |
CPM (INR) |
Skip Rate |
| OOH / Billboards |
82% |
₹5–₹15 |
0% |
| Television |
62% |
₹100–₹300 |
25% |
| Digital Display |
41% |
₹50–₹200 |
65% |
| Social Media Ads |
38% |
₹30–₹150 |
70% |
These metrics highlight the fundamental strength of physical media in a digital-first world. While digital advertising in India reached ₹49,000 crore in FY25, it is increasingly plagued by "banner blindness" and ad fatigue. The AI billboard advertising platform leverages this by ensuring that the brand message is placed where it cannot be ignored. In fact, studies from the Outdoor Advertising Association of America show that 71% of people read billboard messages while driving, making it a critical medium for "passive attention".
Furthermore, the industry's growth is no longer limited to the top-tier metros. While Mumbai and Delhi account for 35% of total OOH spend, tier-2 cities like Pune, Ahmedabad, and Hyderabad are seeing massive infrastructure upgrades that are opening new advertising frontiers. The emergence of "Smart City" projects and new metro networks has created a surge in premium transit inventory. In 2026, brands are using OOH as "brand authentication"—a signal of physical presence and trust in a market where online scams have made consumers skeptical of digital-only brands.
Practical advice for modern media planners
If you are a brand manager looking to maximize your outdoor ROI, you need to stop thinking about "buying boards" and start thinking about "owning corridors." The most effective campaigns are not those with the most locations, but those with the most strategic sequencing. This requires a shift in how you evaluate a proposal.
Here is the part that usually surprises people. The contrarian point that genuinely challenges industry assumptions is that frequency over geographical spread is the secret to OOH dominance. Many brands make the mistake of scattering single boards across an entire city to "cover the map." In reality, it is far more effective to own one arterial corridor—like the Outer Ring Road in Bengaluru—with four or five boards placed in sequence than to have ten boards scattered in isolated spots across the city. The brain needs the same message to hit it multiple times in the same context for the memory to move into long-term storage.
To execute this, you must categorize your locations based on the brand's archetype:
- Luxury Brands: Weight affluence and commercial prestige. A site near the Jio World Convention Centre in BKC is worth ten sites in a residential suburb because it signals status to a high-net-worth audience.
- FMCG & Mass Market: Prioritize transit movement and commute frequency. Use boards near major metro interchanges like Andheri or Ghatkopar, where people are in a "habitual travel" mindset.
- High-Intent Services: Focus on signal-heavy junctions. If you are a healthcare or real estate brand, you need the 45 seconds of dwell time at a major intersection to explain your value proposition.
Finally, do not ignore the digital-physical hybrid. Brands that integrate OOH with mobile retargeting see up to 40% better results. When a consumer sees your billboard on their way to work and then gets a relevant notification or social media ad in the evening, the second exposure hits much harder because the "real-world" board has already established trust.
How to evaluate your outdoor intelligence partner
The choice of an OOH platform often comes down to who has the most inventory. But in an era of digital transformation, the evaluation should focus on the quality of reasoning. A media planner's value today is not in sourcing a board, but in explaining why it belongs on the plan.
Consider the story of a buyer for a major fintech brand. They were presented with two plans for a campaign in Delhi. One plan offered a "premium" unipole at the DND Flyway entry point, citing its 3 lakh daily impressions. The other plan—powered by ADNOXY—suggested a series of smaller, lit boards at the signalized junctions of Ashram and Lajpat Nagar.
The buyer initially favored the DND unipole because of the massive traffic count. But when the reasoning was explained, the decision changed. The Ashram junctions had lower raw traffic than the Flyway, but the "Movement Score" was significantly higher because the average vehicle was stationary for 40 seconds. The Flyway traffic, while massive, was traveling at 70 km/h, meaning the ad was effectively invisible to the driver. The buyer chose the "slower" locations and saw a 52% higher brand recall in post-campaign surveys.
| Evaluation Factor |
Traditional Agency Model |
ADNOXY Intelligence Engine |
| Planning Logic |
Inventory-first (what is available?) |
City-first (where is the audience?) |
| Core Metric |
Raw Traffic / Impressions |
Dwell-Weighted Exposure Score |
| Location Data |
Static catchments |
Hexagonal behavioral modeling |
| Transparency |
Relationship-based pricing |
Data-backed scoring logic |
| Optimization |
Manual selection |
AI-powered corridor intelligence |
This is the shift from "buying space" to "buying intelligence." The Indian OOH market is no longer a dark art. With the right tools, it is a transparent, measurable, and highly efficient engine for brand growth. That is a problem. A big one. At least for the agencies who are still trying to sell plans based on gut feel.
The future of outdoor advertising is about standardizing the evaluation logic so that every rupee spent can be justified. As cities like Mumbai and Delhi continue to expand, and as the 50,000+ billboard locations analyzed by ADNOXY become increasingly connected through DOOH networks, the brands that win will be those that prioritize data over intuition. The transition from presence to precision is the defining trend of 2026.
Frequently Asked Questions
How does hexagonal demand modeling improve OOH planning?
The hexagonal model divides cities into standardized units that prevent the measurement overlap common in square grids. Every hex acts as a behavioral cell, allowing for the precise mapping of movement patterns and audience affluence.
What is the difference between a movement score and a traffic count?
Traffic counts only measure the number of vehicles passing a point, which can lead to low recall on fast-moving roads. A movement score weights locations based on dwell time and signal pauses to ensure the message has enough time to be encoded by the brain.
Why is full attribution still difficult in tier-3 cities?
Tier-3 markets often lack the dense mobility data and connected sensors found in major metros. While ADNOXY can reason about these locations based on infrastructure and city structure, perfect real-time tracking remains a challenge in these fragmented environments.
How do brand archetypes affect the selection of billboard locations?
Archetypes are strategic filters that weight city data based on a brand's specific goals. For example, a luxury brand archetype will prioritize corporate districts and high-end residential zones over general mass-market corridors.
What is exposure sequencing in the context of corridor intelligence?
Sequencing is the strategic placement of multiple boards along a single commuter route. This repetition ensures that a brand becomes part of a commuter’s habitual environment, which significantly increases long-term memory recall compared to a single placement.