AI billboard advertising platform adoption has become the critical factor separating high-growth Indian brands from those trapped in the legacy cycle of gut-feel media planning. In an era where the Pitch Madison Advertising Report 2026 confirms that digital formats now command 60% of India's total advertising expenditure, the outdoor medium has reached a structural tipping point. The industry has moved beyond the simple act of buying space to the complex science of engineering attention.
The shift is not merely about replacing paper with pixels. It is about a fundamental redistribution of power from the supply side—the vendors who happen to have boards—to the demand side—the brands that need to find their audience. As Indian cities expand into massive, multi-nodal urban systems, the old method of choosing locations based on proximity to a mall or a general high traffic claim has become functionally obsolete. Brands like Tata, Axis Bank, and Nestle are increasingly seeking structured, defensible, and standardized evaluation logic to justify every rupee spent in the physical world.
The Indian advertising market in 2026 is no longer a monolith. While traditional media formats face a low-growth yield-management phase, the outdoor sector is the sole legacy survivor witnessing an aggregate growth of approximately 5% annually. This resilience is driven by the expansion of infrastructure, including new metro rail networks and greenfield airports, which creates finite and valuable inventory. For marketers navigating this environment, the ability to layer digital infrastructure—data, signals, and measurement—onto physical assets is the only way to avoid the estimated 40% budget leakage that plagues traditional hoarding buys.
Spatial intelligence and the hexagonal demand model
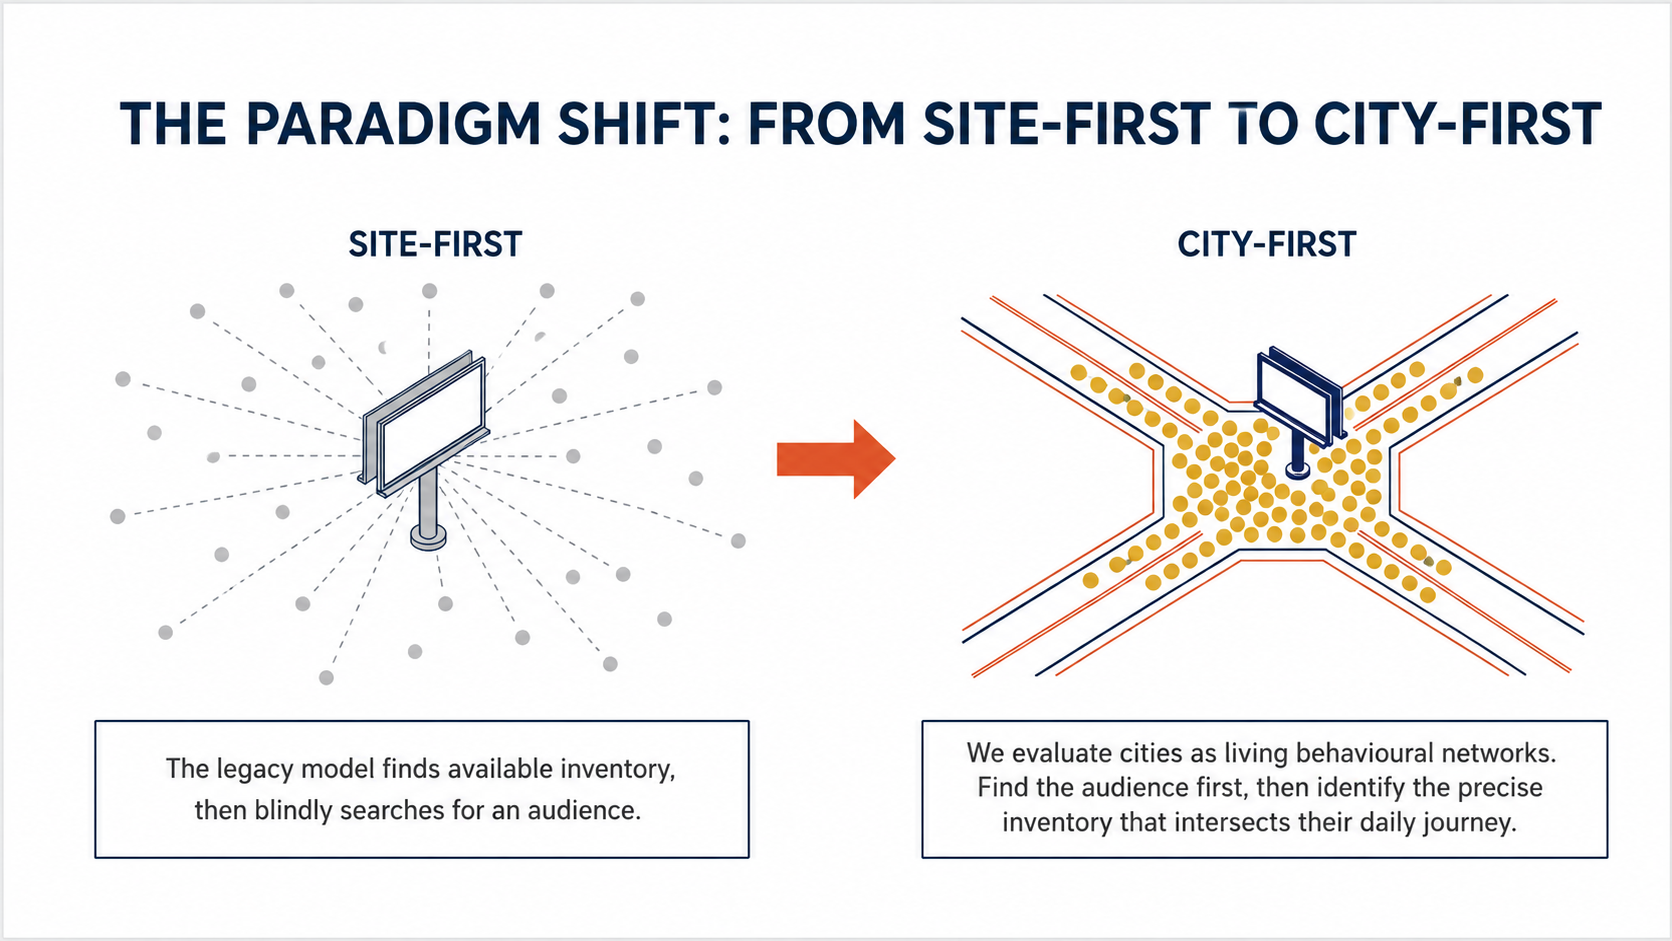
The fundamental technology powering a modern intelligence engine begins by understanding the city as a behavioral system rather than a collection of fixed points. Instead of viewing a single billboard as an isolated asset, the engine models the entire urban structure to determine how areas connect and which corridors anchor human movement. This city-first approach ensures that every media asset inherits strategic value from the underlying spatial patterns it inhabits. By modeling the city before the site, planners can identify which neighborhoods concentrate specific personas and which roads serve as the primary conduits for their daily journeys.
One of the most significant advancements in this field is the use of hexagonal demand modeling. By dividing an urban center like Delhi or Mumbai into thousands of hexagonal cells, each with an approximate edge length of 460 meters, the system creates measurable behavioral units. These cells act as data containers that aggregate movement patterns, point-of-interest density, audience composition, and affluence signals. This granularity allows the system to distinguish between a commercially expensive zone and a transit-inflated zone—a distinction that matters enormously when planning a high-impact campaign.
The engine operates through four scoring dimensions to provide a multidimensional view of every location. The Audience Score measures persona alignment and affluence fit, ensuring that a premium brand is not wasting budget in areas with high traffic but low purchasing power. The Movement Score rewards repeat exposure and optimal dwell conditions, favoring sites where a commuter passes the same message multiple times in a week rather than once at high speed. The Commercial Score models the purchase environment, while the Intent Score evaluates whether a zone fits the specific brand archetype and campaign objective.
Most planners still do not know this. They continue to rely on raw traffic counts, assuming that a flyover with massive throughput is a premium location. Spatial intelligence models often show the opposite. A flyover may produce near-zero recall because movement speeds are too fast for the brain to register a message. Conversely, a neighborhood arterial road with moderate traffic but repeated commuter usage and slower speeds can produce much stronger memory effects and higher brand recall.
Solving the standardization problem in Indian OOH
A real scenario from the Western Express Highway in Mumbai illustrates why standardized evaluation logic has become necessary for modern brands. In early 2026, an automotive brand planned a launch for a premium electric SUV, targeting high-income professionals commuting between the western suburbs and South Mumbai. Traditionally, an agency would have proposed five massive hoardings based on the claim of high footfall near Bandra and Andheri. Without a neutral framework, the brand could not verify if these sites truly captured their target audience at a moment of receptivity.
The challenge was that the proposed sites had different orientations, varied lighting conditions, and different viewing distances. One board was blocked by the construction of a new metro pillar, while another had a viewing window of less than two seconds due to the speed of traffic approaching the Sea Link. This ambiguity is where most media plans fail. When a brand spends crores on a physical campaign, it expects the same auditability it receives from a Meta or Google campaign.
To be direct about something most platforms won't say—full attribution for a static hoarding in a Tier-3 city is still genuinely difficult. Anyone claiming a perfect real-time solution for a traditional board in a town like Gorakhpur or Salem is oversimplifying the operational reality. While we can use phone scans, QR codes, and AI-powered footfall counters to estimate reach, the physical nature of static media means measurement remains a work of triangulation rather than absolute tracking. Acknowledging these limitations is the first step toward building a trustworthy decision intelligence system.
Standardization introduces comparability, scoring standards, and auditability into a market that currently operates on gut feel. It allows a brand to see that a location with lower traffic but higher dwell time might have a higher Visibility Adjusted Contact (VAC) than a massive highway unipole. By providing a strategic explanation for every site—such as whether it functions as a primary anchor or a local recall support—the platform replaces "maybe" with mathematical proof.
Why standard metrics are failing Indian advertisers
When we first built the hexagonal scoring model, the question we kept getting from clients wasn't how accurate the data was, but whether the system could show which zones their competitors were ignoring. That question changed how we think about the entire platform. It shifted our focus from simply ranking available boards to finding "white space" in the city where attention is undervalued. Most brands are fighting for the same ten shouting corridors, while spatial intelligence reveals quiet neighborhoods where target audiences spend more meaningful time.
The closest analogy inside financial markets is Moody's. We do not predict outcomes with absolute certainty, but we introduce standardized evaluation logic into a market that currently has none. By assigning a "credit rating" to each location based on its structural strategic value, we allow brands to compare a site in Pune's Hinjewadi Phase 1 against a site on Bangalore's MG Road with scientific precision. This allows every location to be justified structurally before a single rupee moves.
The current industry problem is that locations often enter media plans primarily because they are available or because the vendor has a relationship with the agency. This supply-side planning dominates the market, leading to plans that are built around what is easy to buy rather than what is effective to see. By inverting this and starting with where the audience actually is, an intelligence engine ensures that inventory follows strategy, not the other way around.
Explore the full platform at adnoxy.com.
The result is a decision intelligence system that treats roads as behavioral systems rather than traffic pipes. This logic recognizes that exposure sequencing—appearing on the same corridor multiple times during a single journey—produces cumulative memory effects that an isolated placement cannot match. The goal is to move beyond the act of buying space and toward the disciplined practice of engineering outcomes through spatial decision logic and auditable attention metrics.
Analyzing the AI billboard advertising platform data and proof
The scale of intelligence required to model the Indian landscape is immense, involving the analysis of over 50,000 billboard locations across every major metro and 50+ Tier-2 cities. This intelligence engine achieves 85% predictive accuracy in forecasting campaign performance, a figure that has made it a trusted partner for blue-chip clients like Tata and Axis Bank. Recognized by Inc42 as one of India's Top 5 AI Startups to Watch in February 2026, the platform is now the primary tool for brands looking to move from presence to precision.
Data from Nielsen India indicates that outdoor advertising delivers an 82% ad recall rate, the highest of any media channel including digital. This effectiveness is further amplified when OOH is integrated with digital campaigns, leading to a 48% higher brand recall. These are not just theoretical gains; they translate into a 38% increase in search queries—a phenomenon known as the billboard effect.
| Format / Metric |
Recall Rate (%) |
Skip Rate (%) |
CPM Range (INR) |
| Traditional Billboards |
82 |
0 |
5 – 15 |
| Television |
62 |
25 |
100 – 300 |
| Digital Display |
41 |
65 |
50 – 200 |
| Social Media Ads |
38 |
70 |
30 – 150 |
| Print (Newspaper) |
55 |
30 |
150 – 500 |
The economic case for using a spatial intelligence engine is equally compelling. By optimizing placements, brands can increase campaign effectiveness by 50% while reducing total spend by an equivalent 50%. This efficiency is critical in a market where prime metro spots can cost several lakhs per month. For example, a single premium board in Mumbai's Bandra or Delhi's Connaught Place can range from Rs 10 lakh to Rs 20 lakh monthly. Without data-backed placement, a brand risks wasting this premium spend on a site with poor visual dominance.
Digital out-of-home is the fastest-growing sub-segment of this sector, expanding at an annual rate of 25-30% in India. By 2026, programmatic DOOH has moved from an emerging option to a standard part of media planning, with spend projected to reach into the billions as inventory digitizes across airports, malls, and metro stations. This shift allows for the application of dynamic creative optimization, where one digital screen can show different versions of an ad based on time of day, weather, or local stock levels.
Practical advice for high-impact outdoor campaigns
A practitioner must look beyond the glossy proposal and understand the underlying data integrity of their media plan. The first step is to define the primary outcome—whether it is store visits, branded search lift, or mass awareness—and then select locations based on the specific strategic role they play. Instead of a list of sites, you should demand a strategy that sequences exposures across a commuter's journey to build cumulative recall.
Here is the part that usually surprises people. The most valuable boards are often not the ones in the highest-traffic zones. In fact, attention scarcity means that a board on a high-density, high-speed flyover is often less effective than a board in a mid-traffic, slow-moving neighborhood arterial where the driver's brain is not overloaded by other stimuli. This is the contrarian truth of 2026: chasing pure volume is a recipe for being ignored. High-speed traffic creates visual wallpaper; slow-speed repetition creates memory.
Brands should also prioritize localized content that resonates with the specific dialect and culture of each neighborhood. Axis Bank's successful MotherTonguelish campaign proved that linguistic authenticity can drive deeper emotional connection than a generic national message. In Tier-2 and Tier-3 cities, OOH often acts as a form of brand authentication, establishing a legitimate physical presence that digital ads cannot replicate.
Finally, you should utilize technologies like QR codes and Bluetooth beacons to bridge the offline-to-online gap. A simple scan can turn a passive viewer into an active lead, providing the performance-centric metrics that modern marketing teams require. By integrating outdoor with mobile retargeting, a brand can reach a consumer on their device within minutes of them passing a specific digital billboard.
How to evaluate your outdoor intelligence platform
The decision to move from manual spreadsheets to an automated platform is often driven by a need for speed and accuracy in a tightening capital environment. A real scenario involving a regional FMCG brand in Pune illustrates this transition perfectly. The brand's media agency initially proposed five massive hoardings on the Mumbai-Pune Expressway, claiming millions of impressions based on highway traffic counts. However, the brand manager questioned whether these impressions were reaching their actual target—regional distributors and local consumers in Tier-3 towns.
When the plan was run through a spatial intelligence engine, the data revealed a different reality. The expressway boards were predominantly seen by weekend travelers from Mumbai, not the regional trade partners the brand needed to influence. The system suggested redistributing the budget toward a network of 50 smaller bus shelters and wall paintings in the "mandi" towns of western Maharashtra. This data-driven pivot resulted in a 15% higher stockist signup rate within two months, while reducing the total media spend by 30%.
| Feature |
Manual Spreadsheet Planning |
Spatial Intelligence Engine |
| Optimization Speed |
2-5 Days |
< 30 Seconds |
| Data Integrity |
Manual copy-pasting; high error risk |
Automated ingestion; single source of truth |
| Decision Logic |
Gut feel or vendor relationships |
Structured dimensions (Audience, Movement, etc.) |
| Campaign Monitoring |
Post-campaign static images only |
Real-time pacing and performance tracking |
| Attribution |
Broad estimates and footfall assumptions |
Triangulated mobility signals and digital lift |
The story of the media buyer in this scenario highlights what truly separates a modern system from a legacy tool. The buyer did not just want a cheaper price; they wanted a defensible strategic rationale that could be audited by their finance team. They needed to see the Visibility Index of each site, understand the affluence mapping of each hexagonal cell, and confirm that their message would be seen by the right people at the right time.
That is a problem. A big one. For years, media planners have operated in an environment where they could not justify their location choices with data. They were forced to rely on terms like "premium location" or "high footfall," which were essentially filler for analysis. A modern intelligence engine removes this ambiguity, providing a decision pipeline that turns a brand's DNA into a mathematically optimized campaign.
The convergence of digitization, infrastructure expansion, and spatial data is redrawing the architecture of the Indian market. The brands that win in 2026 will be those that treat outdoor not as a legacy medium for mass reach, but as a strategic system for engineering attention in the physical world. The era of buying media is over. The era of engineering outcomes has begun.
Frequently Asked Questions
How does spatial intelligence calculate billboard visibility in 2026?
Visibility indices factor in the physical angle of the board, its height from the ground, the duration of the sightline for passing traffic, and potential obstructions like trees or new construction. Perceptual modeling then converts raw traffic counts into actual viewed impressions by adjusting for these specific environmental variables.
What is the difference between VAC and OTS metrics?
Opportunity to See represents the total number of people who could potentially see an ad based on general traffic throughput. Visibility Adjusted Contact is a more precise measure that uses eye-tracking research to determine the number of people who actually looked at the billboard, making it a reliable metric for calculating true ROI.
Why is hexagonal demand modeling used for Indian cities?
Dividing a city into hexagons allows for the creation of measurable behavioral units that aggregate diverse data points like movement patterns and audience affluence. This structure enables a more granular understanding of how different neighborhoods function as part of a connected urban system, improving the accuracy of placement logic.
Can small brands afford to use an outdoor intelligence platform?
Yes, because the market provides a wide variety of formats beyond high-priced metro hoardings, and data-led planning identifies cost-effective sites. Small brands can use street furniture, bus shelters, or digital screens in Tier-2 cities for as little as Rs 5,000 to Rs 20,000 per month, providing high local recall without massive upfront costs.
How does ADNOXY solve the lack of standardization in the market?
The platform introduces a neutral framework for evaluating media plans through four scoring dimensions: Audience, Movement, Commercial, and Intent. This logic provides a standardized credit rating for every location, allowing brands to audit and justify their outdoor spends with the same precision they apply to digital channels.
The transition toward automated, data-driven planning in the outdoor sector is no longer an emerging trend but a structural requirement for success. As the Indian advertising market crosses the Rs 1.75 lakh crore milestone, the distinction between outdoor advertising and physical world intelligence will continue to blur. Brands must move beyond the act of simply buying space to the disciplined practice of engineering outcomes through spatial decision logic and auditable attention metrics.