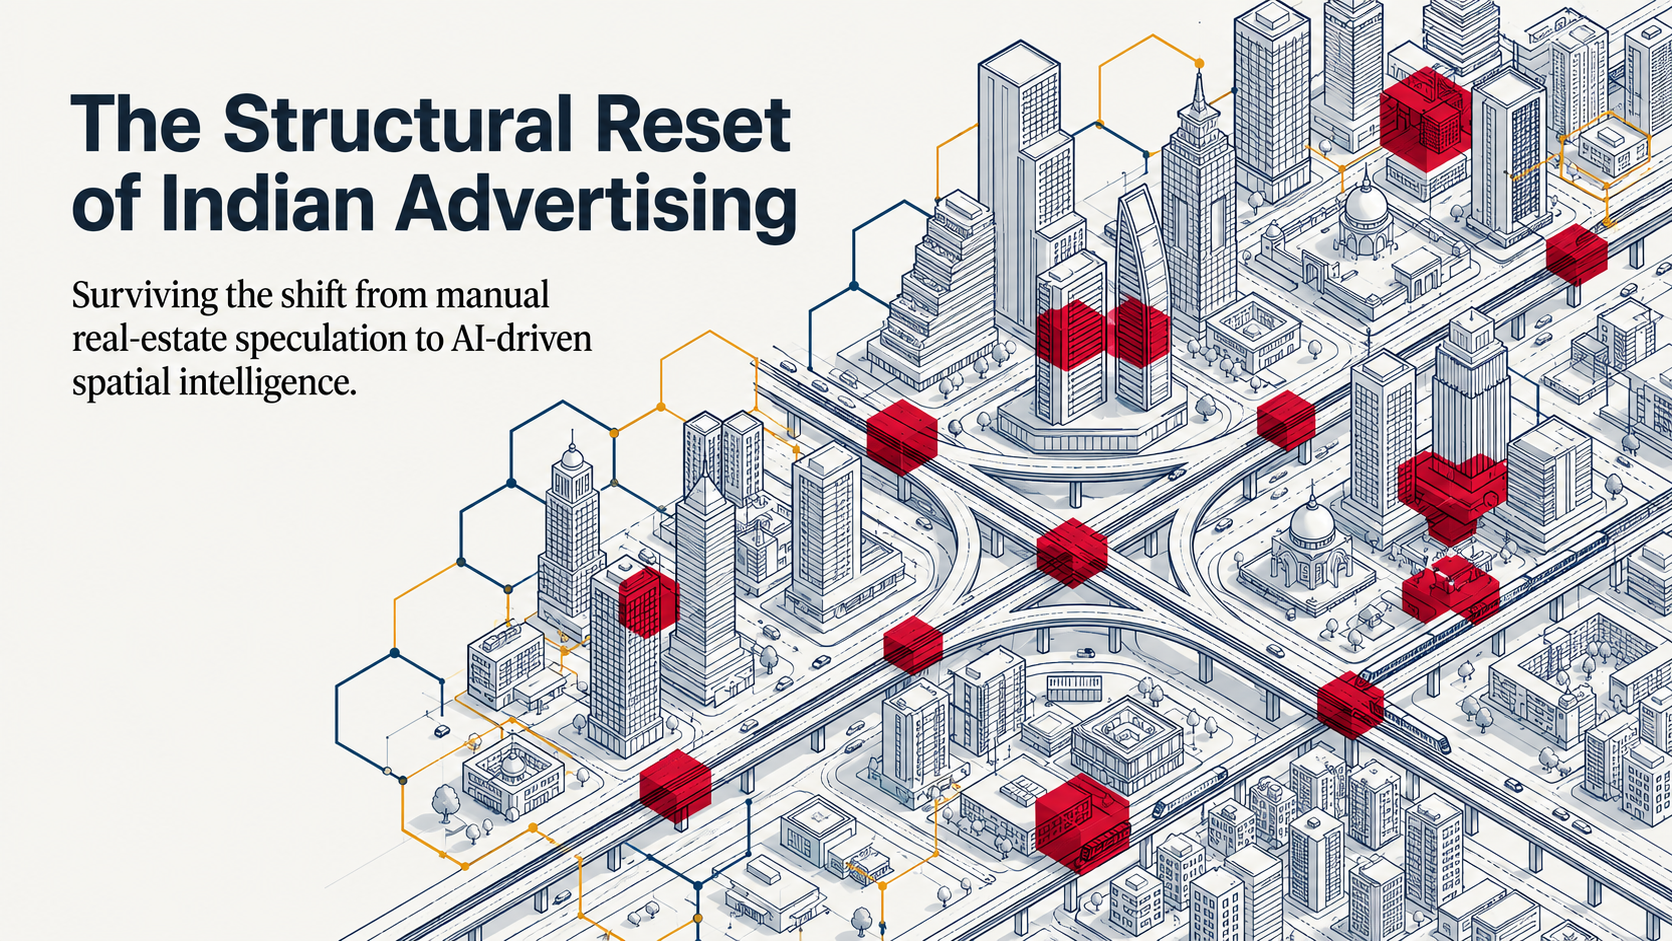
AI media planning platform India is the definitive catalyst for a market that has historically traded on relationships rather than measurable intelligence. The era of the "gut feel" media plan, where locations were selected based on a vendor's proximity to a brand manager's office or a subjective preference for a specific junction, has reached a structural dead end in 2026. For any professional managing a marketing budget in the current economy, the inability to justify a multi-crore outdoor expenditure with the same rigor applied to a performance marketing dashboard is no longer just a frustration; it is a professional liability. The stakes have never been higher, as the Indian advertising industry crosses the ₹1.75 lakh crore threshold, forcing every traditional medium to adopt the accountability standards of the digital age.
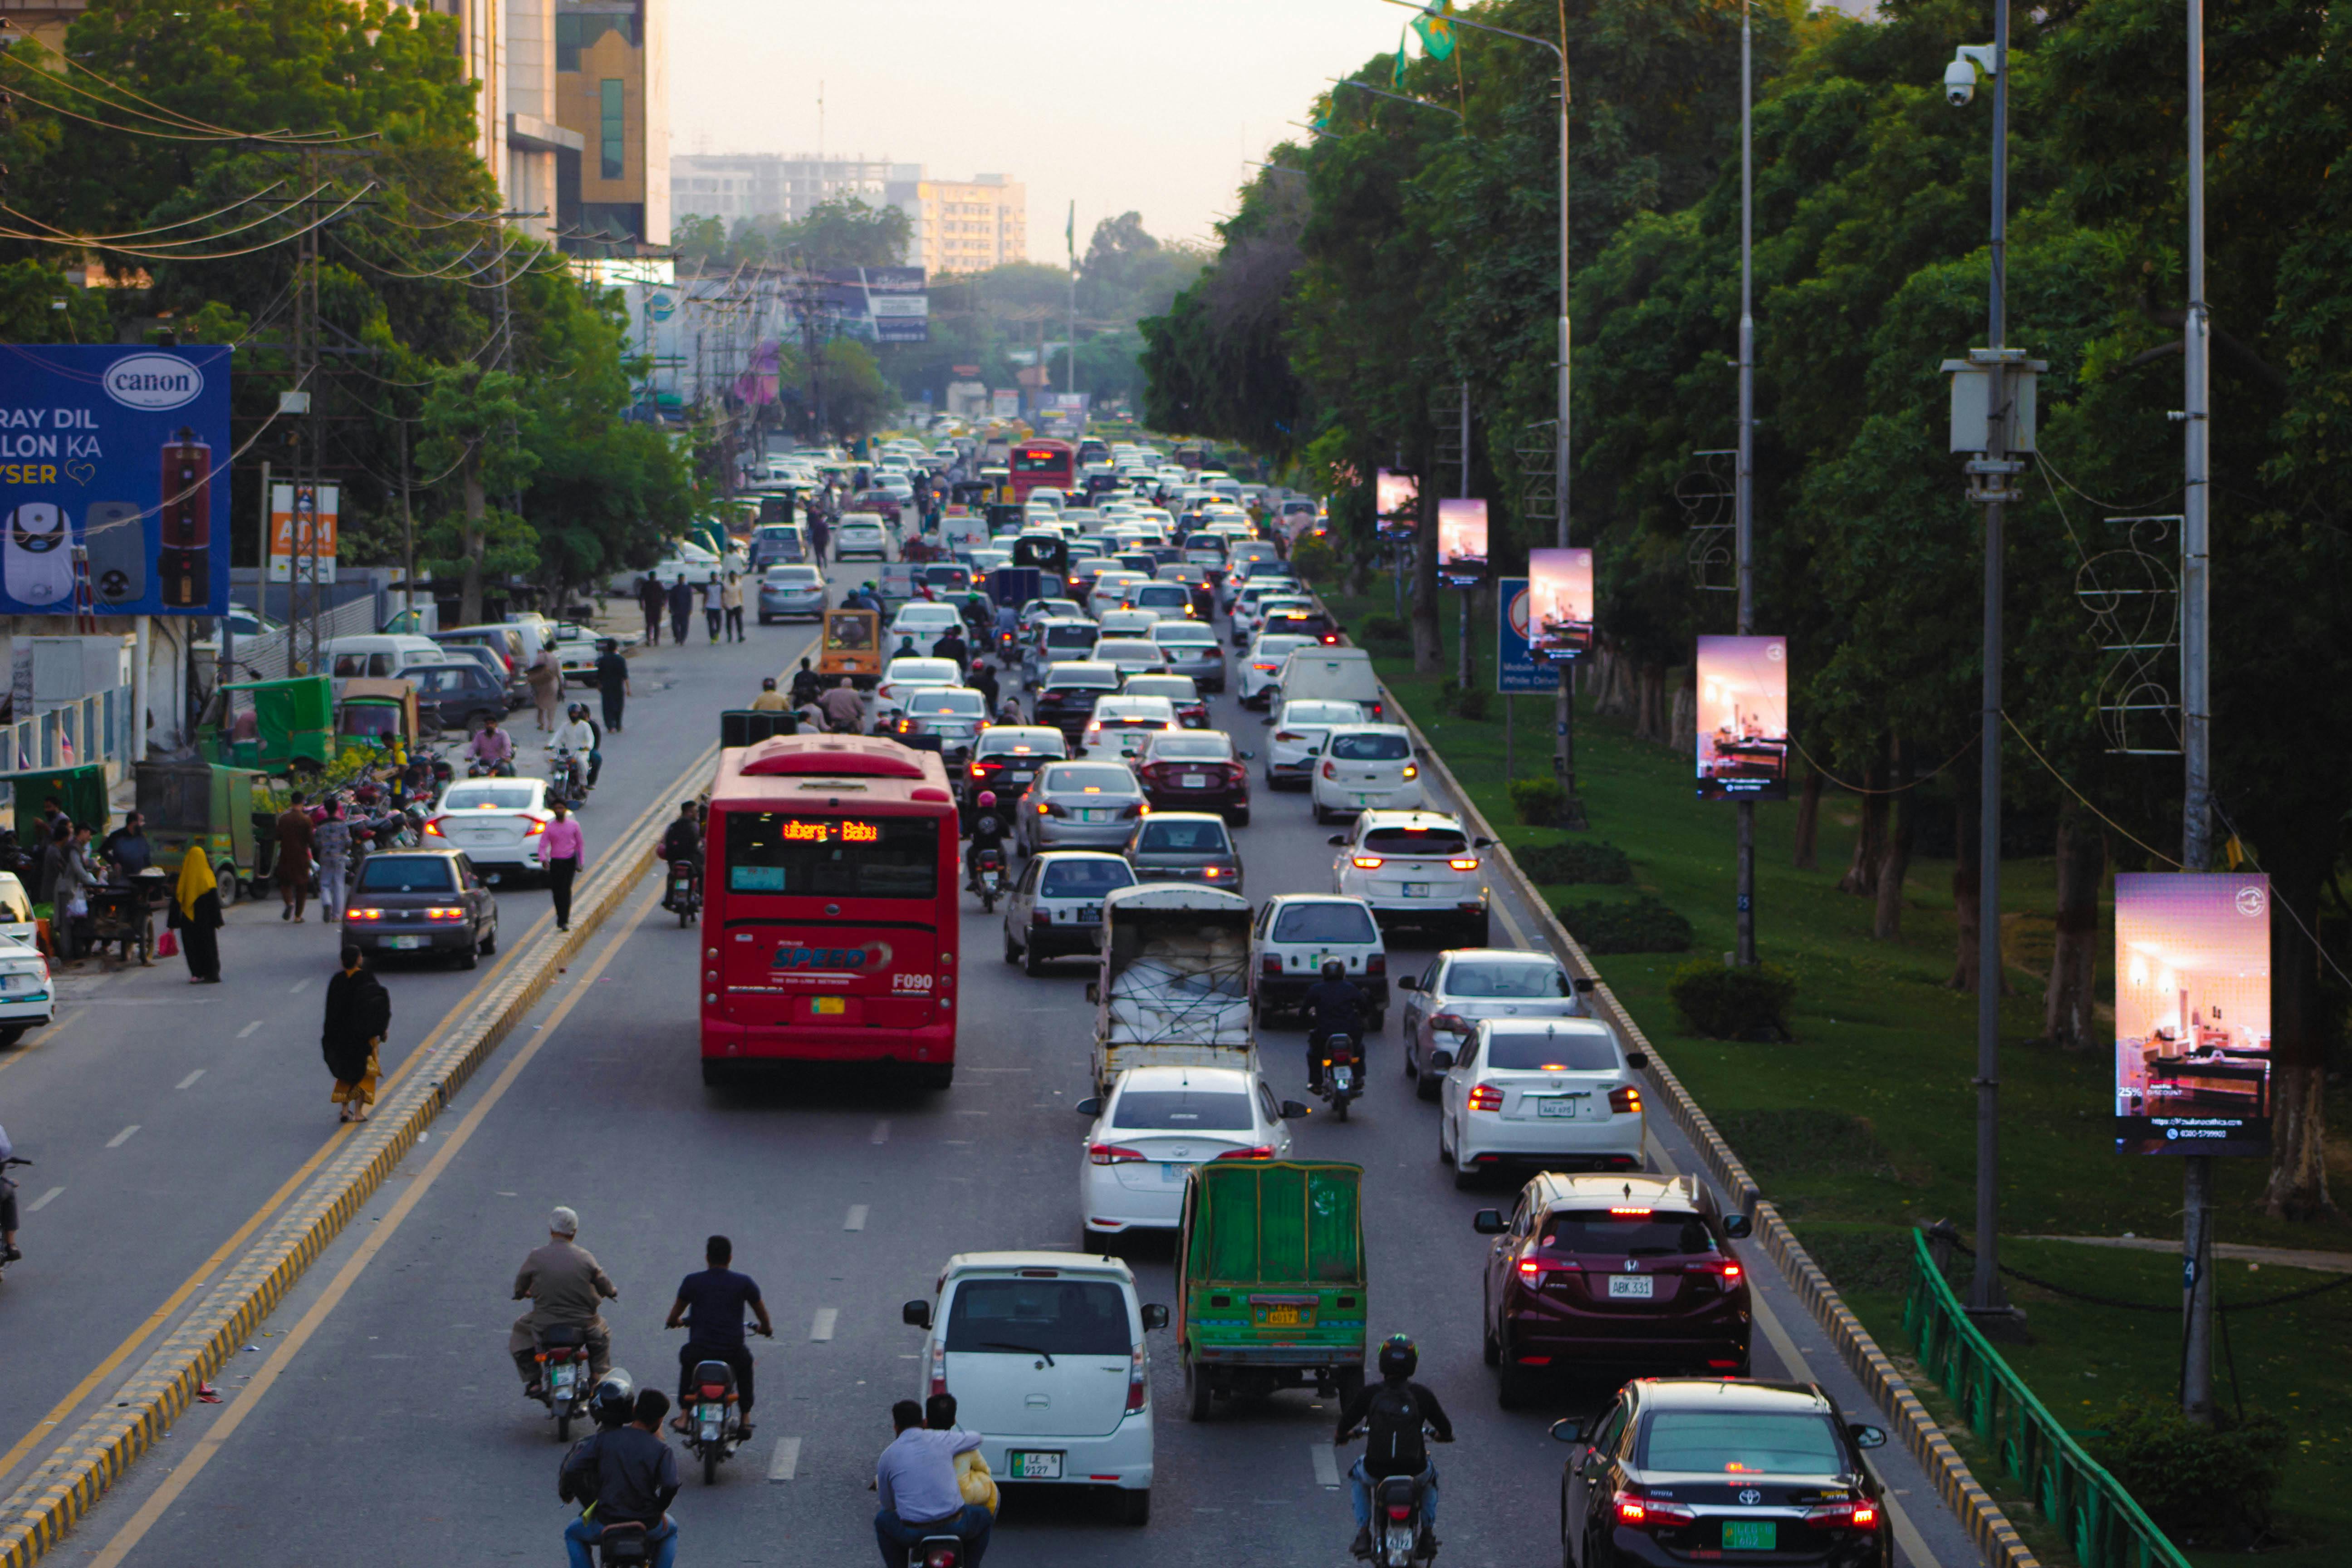
This matters because the Indian consumer has changed faster than the media buying process. While commuters are stuck in the diabolical congestion of Bengaluru's Outer Ring Road or navigating the historical bottlenecks of Mumbai's Western Express Highway, their attention is a fragmented commodity. In 2026, the brands that win the streets are those that treat outdoor media as a decision-grade asset rather than a decorative afterthought. The market has flipped decisively, with digital now accounting for 60% of the total ad spend, leaving out-of-home as the "traditional survivor" that must prove its worth through precision, data-verified results, and structural transparency.
Defining the decision intelligence framework for Indian OOH
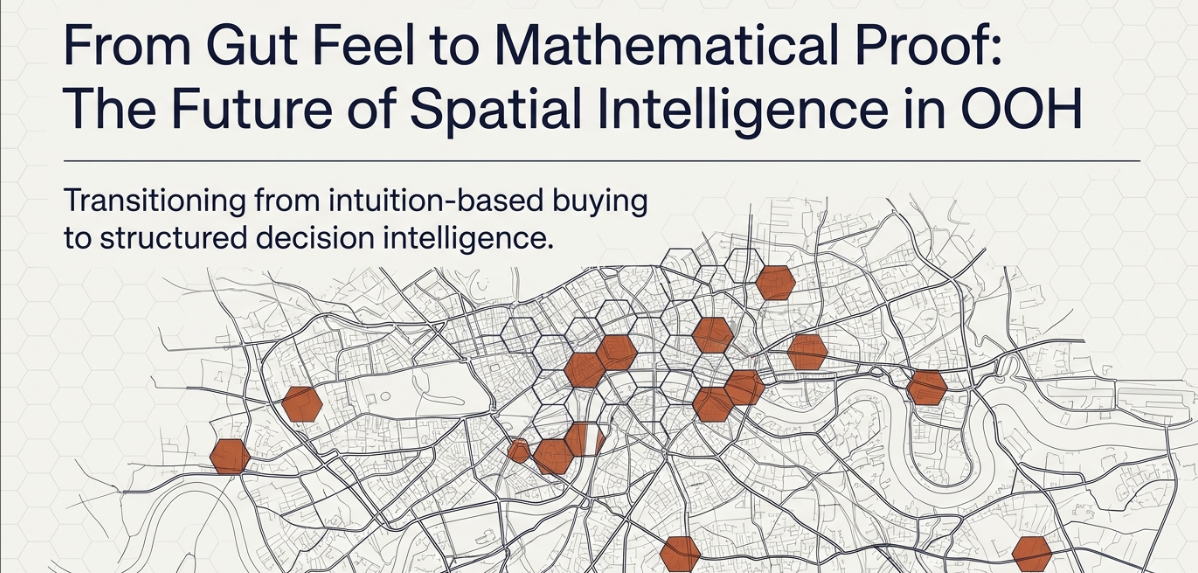
The concept of a decision intelligence engine is not about providing more billboards to choose from, but about providing the logic required to choose the right ones. ADNOXY operates as a spatial intelligence system that evaluates cities as living, breathing behavioral networks rather than static grids. At its core, the platform introduces a level of auditability that was previously reserved for high-stakes financial markets. The simplest way to understand this is through the analogy of a credit rating agency like Moody's. Just as Moody's introduces standardized scoring and comparability into financial markets, this platform introduces structured evaluation logic into a media market that has historically lacked a neutral framework for comparison.
The fundamental unit of this intelligence is the hexagonal demand model. Instead of looking at a city through the lens of individual site addresses, the engine divides the urban landscape into approximately 460-meter hexagonal cells. Every hex functions as a measurable behavioral unit, capturing movement data, point-of-interest density, and the specific composition of the audience passing through that space. By analyzing the city at this granular level, the system identifies how different neighborhoods anchor movement and which corridors dominate the daily commute. Individual assets then inherit their strategic value from the structures above them, ensuring that a billboard's worth is derived from the behavioral context of the hex it occupies, not just its physical size or lighting type.
Most planners still do not know this.
This city-first approach is a radical departure from the site-first model used by traditional agencies. In a site-first world, you look for a board that is available and then try to find an audience for it. In a city-first world, you find where the audience actually is and then identify the inventory that intersects with their journey. This intelligence architecture is built on a multi-layer reasoning pipeline that uses four specific scoring dimensions to evaluate over 50,000 locations across India.
| Scoring Dimension |
What It Actually Measures |
Strategic Outcome |
| Audience Score |
Persona alignment and affluence through quantum profiling |
Ensures the creative reaches the right income segment |
| Movement Score |
Repeat exposure and dwell conditions rather than raw traffic |
Prioritizes memory recall over simple visibility |
| Commercial Score |
Density of purchase environments and relevant POIs |
Aligns placement with the bottom of the sales funnel |
| Intent Score |
Fit between the zone and the brand's specific archetype |
Maintains brand credibility in relevant professional contexts |
These dimensions are not just numbers on a screen; they are different interpretations of the same urban data. A luxury brand will weight the intent and audience scores more heavily to find corporate districts and high-streets, while an FMCG brand might prioritize the movement score to achieve mass exposure across transit corridors. This allows for "Brand Archetype" mapping, where the system autonomously generates a media strategy that fits the DNA of the product. It ensures that the reasoning for every location is explainable, with billboards assigned specific roles such as "Primary Anchor," "Commute Frequency Driver," or "Corporate Signal Board".
The structural crisis of intuition and the supply-side trap
The primary problem that a data-driven system solves is the lack of standardization between agency proposals. In the legacy world, two agencies could take the same brief, the same budget, and the same target city, yet produce two completely different plans with no objective way to determine which is better. This creates a "supply-side trap," where locations are included in a plan primarily because the vendor has a pre-existing relationship with the agency or because the inventory is currently unsold and needs to be cleared.
Consider a real-world scenario on Bengaluru's Outer Ring Road (ORR), a 17-kilometer stretch that houses over 500 tech companies and sees 8 to 10 lakh daily commuters. For years, brands have clamored for visibility on this corridor, often paying premium rates for massive hoardings near tech parks like Ecospace or junctions like Bellandur. However, a major automotive brand recently faced a dilemma: despite a heavy presence on the ORR, their showroom walk-ins were not reflecting the massive "traffic impressions" they were paying for.
That is a problem. A big one.
The reason for this failure was simple, yet invisible to traditional planners. The "Movement Score" for those specific high-traffic sites was actually quite low. While the traffic volume was high, the movement speed during peak hours was so stagnant that commuters suffered from "clutter fatigue"—they were exposed to too many ads for too long, leading to a cognitive filter that blocked out the message. Conversely, at higher speeds, the "dwell time" was insufficient for the complex creative being used. To be direct about something most platforms won't say—full attribution for a static hoarding in a tier-3 city or even a congested corridor is still genuinely difficult, and anyone selling a "perfect" 1:1 conversion map is oversimplifying the reality.
| Corridor Factor |
Traditional Assumption |
Behavioral Reality |
| Congestion |
Higher dwell time = Better recall |
Extreme congestion = Clutter fatigue / Ad blocking |
| High Speed |
Mass throughput = High reach |
Speed > 60km/h = Minimal cognitive processing |
| Sight Lines |
200m visibility is always good |
Obstructions and traffic signs often divert attention |
| Visual Size |
Bigger is always better |
Perceptual size depends on distance from road center |
This is where the honest limitation of the medium must be acknowledged. No AI can perfectly predict if a specific driver was looking at their phone or the road at the exact moment they passed a billboard. However, what we can do is model the "Likelihood to See" based on visibility adjusted contacts (VAC), perceptual size, and real-world obstructions. By moving from raw impressions to "Effective Impressions," we eliminate the noise and focus on the quality of the contact. The goal is not a perfect simulation of every eyeball, but a defensible, standardized logic that moves the industry from guessing to forecasting with an 85% accuracy rate.
Reconstructing the media plan with ADNOXY
When we first built the hexagonal scoring model, the question we kept getting from clients wasn't "how accurate is it?" — it was "can you show me which zones my competitor is not covering?". This question shifted our focus from mere evaluation to strategic intelligence. We realized that brands don't just want to be seen; they want to own a territory. This platform solves this by acting as a "Central Nervous System" for the campaign, providing a single source of truth for both the brand and the inventory owner.
The platform operates at two levels. Level 1 is the practical layer—a media planning business that handles inventory sourcing, branded proposals, and execution workflows. Level 2 is the actual "Real Build"—a spatial intelligence engine that models movement behavior and generates strategies autonomously. This dual-level approach allows us to pay the bills with current media buying while we build the future of urban modeling.
Explore the full platform at adnoxy.com.
By treating roads as behavioral systems rather than simple traffic pipes, the platform enables "Exposure Sequencing". This is the practice of placing a brand multiple times along a commuter's specific journey, creating a cumulative memory effect that is significantly more powerful than a one-off placement. For example, a commuter traveling from the Western Express Highway in Mumbai to the Bandra-Kurla Complex will be exposed to the brand at specific intervals, each placement reinforcing the last. This isn't just about reach; it's about building a cognitive "ladder" that leads to long-term recall.
This works because the system accounts for "Quantum Profiling," a proprietary method for audience affluence mapping. It distinguishes between "genuinely affluent" zones, like the residential pockets of South Mumbai, and "transit-inflated" zones where the traffic volume is high but the target persona alignment is low. For a wealth management firm or a luxury car brand, this distinction is the difference between a successful campaign and wasted expenditure.
Data and proof: The shifting AdEx landscape of 2026
The performance of out-of-home advertising in India is currently defined by a divergence from other traditional media. While linear television and print are struggling with flat or declining revenues, OOH is growing in both absolute and relative terms. According to the Pitch Madison Advertising Report 2026, the total advertising expenditure in India reached ₹1,55,105 crore in 2025 and is projected to rise to ₹1,74,605 crore this year. Within this "Total AdEx," digital now accounts for a massive 60% share, while traditional media stands at 40%.
However, the "Traditional Survivor" is the outdoor sector, which recorded a robust 13% growth in 2025, significantly outpacing other formats. This growth is being driven by the rapid premiumization of assets and the expansion of digital out-of-home (DOOH), which now contributes nearly 18% of total OOH revenues. The transition to digital screens has allowed for programmatic capabilities and dynamic content that bridges the gap between the physical and online worlds.
| AdEx Medium (Expanded Definition) |
2025 Actual (₹ Cr) |
2026 Forecast (₹ Cr) |
Projected Growth |
| Total Digital (Core + Q-Comm + MSME) |
93,156 |
1,11,976 |
20% |
| Outdoor (OOH) |
4,835 |
5,077 |
5% |
| Linear TV |
32,855 |
32,855 |
0% |
| Print |
20,866 |
21,388 |
3% |
| Total Indian AdEx |
155,104 |
174,605 |
13% |
The effectiveness of these campaigns is no longer a matter of debate. Data from MAGNA Intelligence indicates that AI-driven precision in outdoor advertising can boost engagement rates by up to 30% compared to traditional methods. This why ADNOXY has been recognized by Inc42 as one of India's Top 5 AI Startups To Watch in February 2026. With a scale that covers 50,000+ billboard locations and a trusted client list including Tata, Axis Bank, and Nestlé, the platform is setting the standard for how the ₹5,000 crore outdoor market should be evaluated.
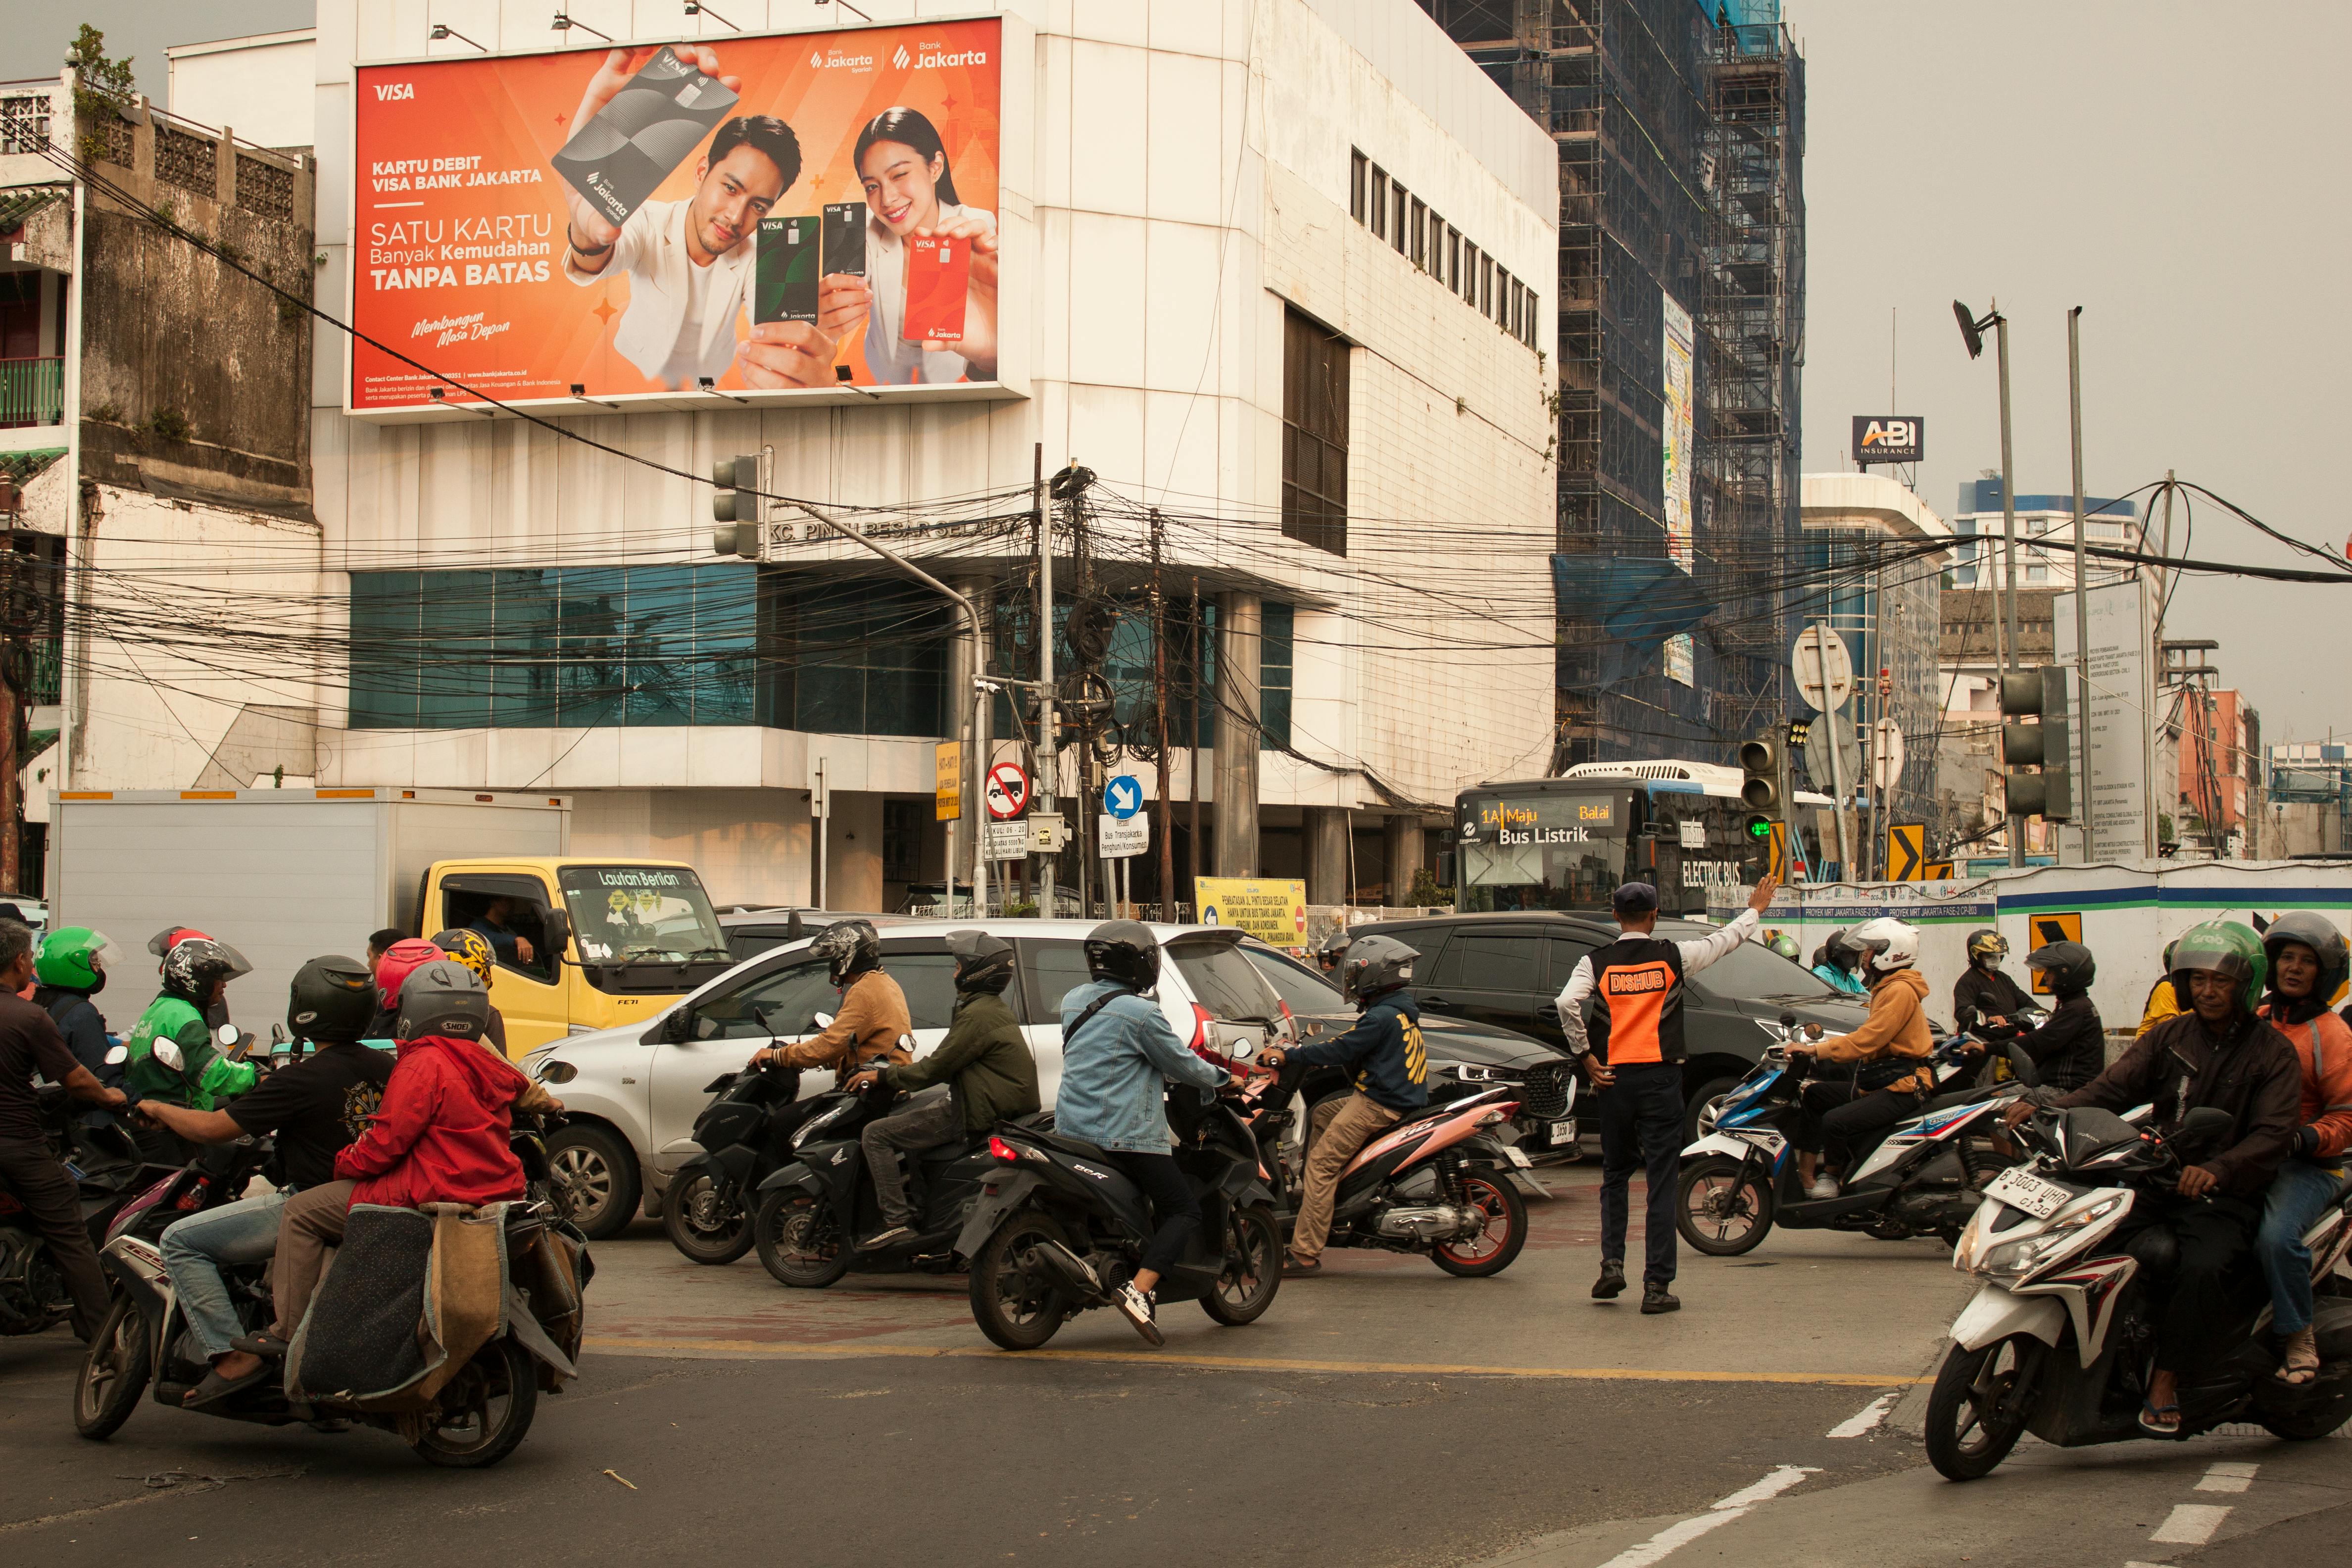
Implementing an AI media planning platform India requires moving away from the "lowest-price-per-site" mentality to an "attention-per-rupee" model. In the legacy system, a brand might celebrate getting a "discounted" rate on a gantry along the DND Flyway in Delhi. But if that gantry is positioned after a sharp curve where drivers are focused on lane-keeping, the actual "Verification Adjusted Contact" could be less than 10% of the total traffic volume. The data-verified approach proves that the "cheaper" board was actually the more expensive one in terms of effective impressions.
Practical advice: Thinking like a data-driven practitioner
Most media planners are still stuck in a world where they buy "reach." But in outdoor, reach is a commodity; attention is the asset. If you are looking to run a campaign in 2026, you need to challenge the assumptions that have dominated the industry for the last three decades.
Here is the part that usually surprises people.
The most effective billboards in a city are often not the ones on the busiest highways. While a site on Mumbai's Western Express Highway might see 5 lakh vehicles a day, a neighborhood arterial road in a residential pocket of Pune or Ahmedabad with moderate traffic could produce much stronger memory effects. This is because the commuter is exposed to that neighborhood board multiple times a week at a slower speed, allowing the brain to move from "noticing" to "processing" to "remembering". High-speed expressways are for brand authority; residential arterials are for brand recall.
Actionable steps for your next campaign
- Define your brand archetype first. Don't just pick sites. Tell your platform whether you are a luxury player looking for corporate signaling or an FMCG brand looking for mass transit frequency.
- Audit for speed, not just volume. A traffic jam is your friend for dwell time, but "clutter fatigue" is your enemy. Look for sites that offer a clear 5-10 second viewing window at a speed of 20-40 km/h.
- Use the hexagonal logic. Demand to see the affluence mapping and POI density around your chosen locations. If a billboard is "near a mall," find out if it's on the path of the mall's target audience or just in the general vicinity.
- Stop buying short bursts. Brands are moving beyond short-term visibility to "sustained presence" that reinforces leadership over time. A single month of outdoor is often a waste of budget; a three-month deployment on a strategic corridor is an investment in consumer memory.
- Integrate with mobile. Out-of-home should be the physical anchor for your digital storytelling. Ensure your physical presence is amplified by geo-targeted mobile ads to those who have passed your billboards.
Gut feel is dead.
The practitioner's goal is to move from being a "buyer of inventory" to a "builder of attention systems." This means understanding that the cost of a billboard includes not just the rental, but the cognitive load it places on the commuter. A cluttered, poorly designed creative on a premium gantry is a double loss: you lose the rental money and you damage the brand's credibility.
How to evaluate the right platform for your brand
Choosing the right partner in the outdoor space is increasingly difficult because every vendor now claims to use "AI" or "data." You need to be able to distinguish between an aggregator that has just digitized a spreadsheet and a decision intelligence engine that understands spatial behavior.
As one media planner put it: "We stopped trusting gut feel the day ADNOXY showed us the data."
I recently sat in a client meeting for a major SUV launch where two agencies presented their OOH plans. The first agency brought a standard site list of "premium junctions" in Mumbai and Delhi, justified by high-traffic estimates from the local municipal bodies. The second agency—using ADNOXY—didn't start with junctions. They started with a map of where the current SUV owners in those cities lived and where they spent their weekends. They showed a sequence of boards along the Mumbai-Pune Expressway and the Delhi-Jaipur Highway that targeted these families during their weekend getaways. They identified that while the Western Express Highway had more traffic, the "Intent Score" for a premium SUV was 40% higher on the weekend expressway routes.
The client didn't just choose the second plan; they increased the budget for it because the reasoning was auditable. They weren't buying "hoardings"; they were buying a confirmed path to their audience.
| Feature Comparison |
Manual Listing Platforms |
ADNOXY Intelligence Engine |
| Logic Base |
Relationships and site availability |
Hexagonal demand and spatial behavior |
| Scoring |
Non-existent or subjective |
Multi-layer Audience, Movement, Intent |
| City View |
Site-first (find a board) |
City-first (find the audience) |
| Analytics |
Raw traffic counts (OTS) |
Visibility Adjusted Contacts (VAC) |
| Workflow |
Emails and phone calls |
Automated quotes and data-backed plans |
When evaluating a platform, ask if they can explain the "role" of every site in your plan. Can they tell you which site is an "Anchor" and which is a "Frequency Driver"? Can they provide the affluence mapping for the specific 460m hex around the site? If they can only talk about "high footfall" and "near a station," they are selling you inventory, not intelligence.
Trust is rare. In the outdoor industry, it has to be manufactured through data transparency. The future of the medium depends on its ability to move from an opaque "black box" of vendor-client relationships to a transparent, auditable system where every rupee is justified before the first vinyl is printed.
The Indian out-of-home market is undergoing a quiet but decisive reset. The brands that will dominate the streets in the coming years are those that stop guessing and start measuring. By treating the city as a complex behavioral system and billboards as strategic anchors within that system, we are finally bringing the accountability of the digital age to the physical world. The era of guesswork is over; the era of decision intelligence has begun.
Frequently Asked Questions
How does AI improve billboard targeting in India?
AI models cities as behavioral systems by analyzing movement data, affluence signals, and point-of-interest density within granular hexagonal cells. This allows brands to place ads where their specific target audience actually spends time rather than just where the traffic is highest.
What is the hexagonal demand model in OOH?
The city is divided into standardized hexagonal units of roughly 460 meters, which allow the system to model movement and behavior more accurately than traditional grids. Each hex becomes a data point that aggregates audience composition, traffic speed, and commercial relevance.
Why is raw traffic volume a misleading OOH metric?
High traffic volume often comes with high movement speeds or extreme visual clutter, both of which can reduce an ad's recall rate to near zero. A slower arterial road with repeat commuter exposure often delivers much higher memory effects than a massive highway with high-speed throughput.
What are the four scoring dimensions of ADNOXY?
The platform evaluates every site based on Audience (persona alignment), Movement (exposure quality), Commercial (purchase environment), and Intent (brand archetype fit). These scores provide a structural justification for every location included in a media plan.
How can brands audit their outdoor advertising spend?
Data-driven platforms introduce auditability by providing standardized scoring and explainable logic for every site selection. This replaces subjective justifications with verifiable data points like affluence mapping, visibility adjusted contacts, and corridor intelligence.