AI outdoor advertising software India has become the structural backbone for brands that no longer want to gamble their marketing budgets on the anecdotal promises of media vendors. The Indian advertising market, which reached ₹1,55,105 crore in 2025, is currently undergoing a violent correction where traditional "gut feel" is being replaced by spatial logic. By early 2026, the structural flip is complete: digital now accounts for 60% of total ad spend, leaving legacy media to either adapt through intelligence or face a slow slide into irrelevance. While linear television and print are struggling to maintain flat growth, the Out-of-Home (OOH) sector stands as the only traditional medium growing in absolute rupee terms, precisely because it has started to think like a digital platform.
The shift matters now because the 2026 market is defined by three high-velocity engines: Connected TV, Quick Commerce (Q-Comm), and a massive surge in MSME digital spending. Q-Comm platforms like Blinkit and Zepto grew by 202% last year, and their demand for hyper-local visibility has forced the OOH industry to provide a level of precision that was previously impossible. Brands are no longer buying billboards; they are buying audience-aligned movement corridors. If a media plan in 2026 does not use a decision intelligence system, it is effectively an expensive list of locations based on which vendor had the best relationship with the agency.
Defining the Hexagonal Logic of Modern Spatial Intelligence
Understanding how modern software actually works requires a complete departure from the old way of mapping cities. Historically, a city was seen as a flat map with pin-drops representing available billboards. The intelligence architecture of platforms like ADNOXY treats a city as a living behavioral system. Instead of site-first planning, the engine adopts a city-first approach, understanding how neighborhoods connect and which corridors anchor the daily movement of specific target segments. This is not just a cosmetic change in data visualization; it is a fundamental shift in how the value of an asset is calculated.
The system divides the entire urban sprawl into hexagonal cells, each with an edge length of approximately 460 meters. Each hex is not just a geographic boundary; it is a measurable behavioral unit that aggregates data from mobile movement, point-of-interest density, and affluence signals. This allows the software to model demand in the same way a financial rating agency like Moody's models credit risk. It introduces comparability and standardized scoring into a market that used to operate on vague terms like "premium location" or "high footfall".
That is a problem. A big one.
Planners often assume that traffic volume is the only metric that matters, but the hexagonal model proves otherwise. It uses four distinct scoring dimensions to evaluate every cell. The Audience Score measures persona alignment and affluence fit. The Movement Score is more sophisticated, rewarding repeat exposure and dwell conditions rather than raw throughput. A Commercial Score models the purchase environment surrounding a location, while the Intent Score evaluates if the zone fits the specific archetype of the campaign—be it luxury, FMCG, or real estate.
The Flyover Paradox and the Failure of Traditional Metrics
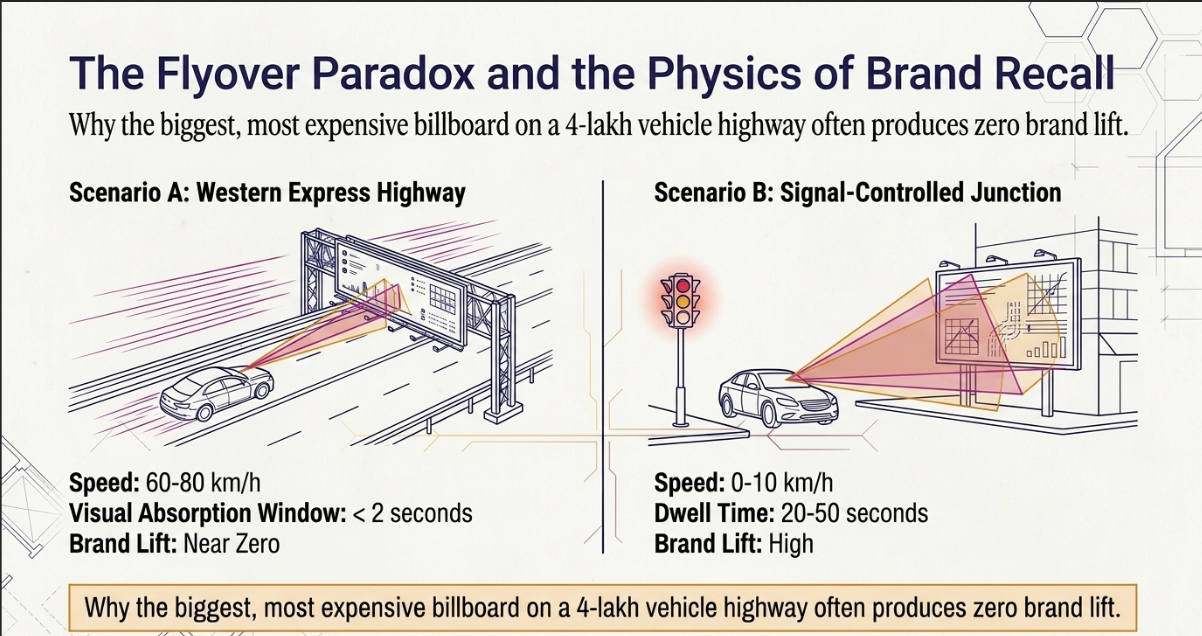
To understand the problem this intelligence solves, look at the Western Express Highway (WEH) in Mumbai. This is one of the busiest corridors in the country, with traffic volumes reaching 4-5 lakh vehicles daily on the Bandra-Andheri stretch. On paper, any billboard here looks like a winner. However, a luxury brand recently placed a high-budget campaign on a massive flyover hoarding near the airport, only to see near-zero brand lift. The reason was simple: the traffic speed on that specific stretch was too high. At 60-80 kilometers per hour, the visual absorption window is less than two seconds, which is insufficient for any complex brand message to register.
This is where traditional media plans fail. They ignore the physics of recall.
To be direct about something most platforms won't say—full attribution for a static hoarding in a tier-3 city is still genuinely difficult. Anyone selling you a complete solution for that specific problem is oversimplifying it. While we can use telco data and mobile pings to estimate reach, the actual cognitive recall depends on the speed of the vehicle and the clutter of the surrounding environment. A location with moderate traffic but slow-moving vehicles at a signal-controlled junction often produces a stronger memory effect than a massive billboard on a high-speed gantry.
The industry is littered with "gut feel" decisions that cannot be audited. When a brand runs a campaign on a social platform, they can audit every rupee spent. In OOH, they typically receive a site list and a few vague traffic estimates. Intelligence platforms change this by introducing explainability. Every location is assigned a role: a PRIMARY_ANCHOR to create authority, or a COMMUTE_FREQUENCY_DRIVER to generate repetition. If a location cannot be justified structurally, it is removed from the plan before money moves.
Why AI Outdoor Advertising Software India is a Strategic Necessity
Most planners still do not know this. The real value of an intelligence platform is not in finding billboards; it is in modelling movement behavior to create cumulative memory effects. ADNOXY operates at two levels simultaneously. Level 1 is the logistics layer—sourcing inventory and creating branded proposals. Level 2 is the actual core—a spatial intelligence engine that models the city and scores locations autonomously based on 50,000+ analyzed spots across India.
When we first built the hexagonal scoring model, the question we kept getting from clients wasn't "how accurate is it?"—it was "can you show me which zones my competitor is not covering?" That question changed how we think about the entire platform. It moved us away from just being a measurement tool and toward becoming a decision logic system. The system treats roads as behavioral systems rather than pipes for traffic. By understanding "corridor intelligence," brands can sequence their exposures, appearing multiple times in a single journey to solidify recall. Explore the full platform at adnoxy.com.
This logic is particularly powerful when applied to specific brand archetypes. A real estate brand targeting luxury buyers in South Delhi does not need mass exposure. It needs a "Corporate Signal Board" strategy on the DND Flyway or near Barakhamba Road, where the unique reach of 1,050,000 individuals includes a high concentration of financial executives and high-net-worth households. Conversely, an FMCG brand launching a new snack needs "Transit Inflation" zones—areas where the sheer volume of commuters near stations like Dadar or Mumbai Central creates a massive funnel of potential impressions.
Statistical Evidence and Market Validation
The scale of the shift is evident in the numbers reported by Madison World and Pitch in early 2026. The total advertising market has crossed ₹1.75 lakh crore, with digital taking a dominant 64% share. In this environment, the OOH sector has managed to survive and grow by 5% because it has embraced accountability. Platforms today achieve an 85% predictive accuracy in campaign performance forecasting, which has brought blue-chip clients like Tata, Axis Bank, and Nestlé into the ecosystem.
Data from 2025 shows that traditional media clusters—print, radio, and cinema—are moving in a narrow band of -5% to +5%, essentially confirming a yield-management phase. Outdoor advertising, however, has stayed on the positive side of that band. This is driven by the expansion of Digital OOH (DOOH), which allows for dynamic creative rotation and day-parting—strategies that were once exclusive to the digital web.
| OOH Market Metrics 2026 |
Value / Percentage |
Source |
| Predictive Accuracy in Forecasting |
85% |
ADNOXY Internal |
| DOOH Projected CAGR (2026-2031) |
6.95% |
Mordor Intelligence |
| OOH Share of Total ADEX |
~3–4% |
PMAR 2026 |
| Unique Reach of DND Flyway Billboard |
10,50,000 |
Acme Advertising |
| Unique Reach of Bandra–Worli Sea Link |
9,00,000 |
Acme Advertising |
| Minimum Recall exposure threshold |
3+ exposures |
Blip Billboards |
These stats are not just empty metrics. They represent a fundamental change in how the industry is measured. As one media planner put it: "We stopped trusting gut feel the day ADNOXY showed us the data." The adoption of "quantum profiling" for audience affluence mapping has allowed brands to distinguish between "commercially expensive" zones and "genuinely affluent residential" zones—a distinction that often determines the success or failure of a luxury campaign.
Practical Advice for the 2026 Media Planner
If you are currently planning a campaign, you need to stop chasing reach as your primary metric. Reach is a vanity number in a city as dense as Mumbai or Delhi. Here is the part that usually surprises people. A location with a massive vehicle count can often be the worst possible choice for your brand if the movement speed is too high or the visual clutter is too dense. Instead, you should be optimizing for "effective frequency"—the number of times a unique person sees your ad at a baseline level.
The contrarian point that most agencies won't tell you is that a single premium billboard is often less effective than four smaller, well-placed boards on a single commuter arterial. Mumbai’s geography is a perfect example of this. Because 3 crore commuters are funneled through just 3 corridors—the WEH, LBS Marg, and the Eastern Express Highway—a single mobile van or well-placed hoarding can encounter the same commuter 2.8 times per week. This "forced repetition" produces recall rates 40% higher than sprawl-city campaigns in Delhi or Hyderabad, where commuters have multiple bypass routes.
Practitioners should also look at the purchase environment. A premium real estate brand should be willing to pay ₹5L – ₹10L per month for a gantry on the WEH or a unipole near the Sea Link approach, but only if they can verify that the sightlines are clear for 200+ meters. If the sightline is blocked by a flyover pillar or competing ads, the "cost-per-effective-impression" skyrockets, making the "cheap" board the most expensive one in the long run.
Evaluating the Right Intelligence Partner
Help your procurement team move beyond cost-per-square-foot. When evaluating a platform, the narrative shouldn't be about how many boards they have in their database; it should be about how they reason through location selection. I recall a meeting with a major fintech brand where they were shown two different plans for Bengaluru. One plan used a traditional approach, selecting high-traffic spots on MG Road and Indiranagar. The other plan used spatial intelligence to identify that their target audience—tech professionals—actually spent 70% of their commute time stationary on the Outer Ring Road near Marathahalli and Bellandur.
The second plan, though it had a lower total vehicle count, delivered double the app downloads. This is because it prioritized "dwell time" over "reach". When vehicles are stationary for 20-50 minutes in traffic chokepoints, they have a massive window for brand absorption. This is the difference between buying an ad and buying attention.
| Feature Comparison |
ADNOXY |
Traditional Aggregators |
Global DSPs |
| Measurement Logic |
Hexagonal Demand Modeling |
Site-based traffic counts |
Generic mobile pings |
| Auditability |
Full strategic reasoning logs |
Limited / None |
High for DOOH only |
| Inventory Scale |
50,000+ Indian locations |
Varies by vendor |
Limited to DOOH screens |
| Decision Engine |
City-first behavioral modeling |
Manual selection |
Programmatic bidding |
| Pricing Model |
Transparent CPM / Site rates |
Opaque / Negotiated |
Dynamic / Bid-based |
| Affluence Mapping |
Quantum Profiling (Behavioral) |
PIN code based (Static) |
Demographic averages |
The 2026 market doesn't have room for a "dark tunnel" of planning. Brands that continue to buy OOH purely on reach and frequency without context are essentially funding a legacy system that no longer works. The future of the sector is not in more screens or bigger boards; it is in the ability to prove that every placement has a structural reason for existing in the plan. As infrastructure continues to expand and "Bharat" reshapes consumption, the only way to stay relevant is to move from presence to precision.
Outdoor advertising is no longer a standalone medium; it is a critical component of an "Integrated Attention System". By integrating spatial intelligence with digital intent data, brands can finally close the loop between the billboard on the road and the purchase in the store. The transition is inevitable—the only question is whether your brand will lead the shift or be left trying to justify a gut-feel decision in a data-driven world.
Frequently Asked Questions
How does AI-powered software differ from traditional billboard agencies?
Traditional agencies often prioritize inventory they own or have pre-negotiated relationships with, leading to supply-driven planning. AI-powered platforms like ADNOXY use a demand-driven approach, identifying where the audience actually is through hexagonal behavioral modeling before finding the right inventory to match. This introduces a neutral, auditable framework that prevents relationship-based bias in media selection.
Can these platforms track actual sales lift for offline advertisements?
While a direct click-to-buy is not possible for static billboards, platforms use mobile-location analytics and geofencing to track store visits after ad exposure. This allows brands to calculate a "cost-per-store-visit" metric, pulling OOH spend into the performance-marketing funnel rather than treating it as a pure awareness play. By 2026, many brands are already using this data to shift budgets from expensive digital line items to more effective OOH placements.
Why is traffic speed a critical metric in OOH media planning?
High-speed traffic significantly reduces the time a commuter has to process an advertisement, often leading to near-zero recall for complex messages. AI intelligence platforms model these speed zones, prioritizing locations near signals or chokepoints where "dwell time" is higher. A location with lower traffic volume but higher dwell time can often deliver a much higher ROI than a high-speed highway stretch.
What are hexagonal demand models and why are they used?
Hexagonal demand models divide a city into small, measurable cells to aggregate movement, POI density, and audience composition data. This provides a more standardized and accurate way to evaluate urban spaces compared to traditional, irregularly shaped neighborhoods or simple pin-drops. It allows for a level of spatial logic and comparability across different cities that was previously impossible.
Is Digital OOH always better than traditional static billboards?
Digital OOH offers flexibility and real-time triggers, but static billboards still provide 100% share of voice and 24/7 visibility for building long-term brand equity. AI platforms help planners balance these two by identifying when to use DOOH for "activation" bursts and static for "anchoring" consistent brand presence. The right choice depends on whether the campaign goal is immediate sales activation or multi-month trust reinforcement.