AI driven billboard performance scoring offers Indian brands the same baseline credit-check confidence for real-world placements that financial institutions get from a CIBIL score before lending money. For years, out-of-home media investments have been plagued by a total lack of standardisation, forcing marketing heads to allocate lakhs of rupees based purely on gut feel and agency relationships. Securing a high-impact hoardings campaign should not feel like a shot in the dark when every single digital rupee is traceable.
As India's total advertising spend climbs toward ₹1,11,000 crore in 2026, the demand for measurable physical presence on our city streets is reaching an all-time high. This surge is happening against a backdrop of massive urban transit expansions, with new metro stations and high-speed corridors opening monthly to capture a captive commuting audience. Marketers are finding that while digital display banners can be easily skipped or blocked, physical displays remain unskippable. Consequently, brands require an objective evaluation standard to justify their offline investments to boardrooms that are increasingly focused on efficiency over sheer scale.
Demystifying the rating system and the hexagonal demand model
The underlying rating system does not judge a billboard in isolation; instead, it evaluates the entire spatial context of the city first.
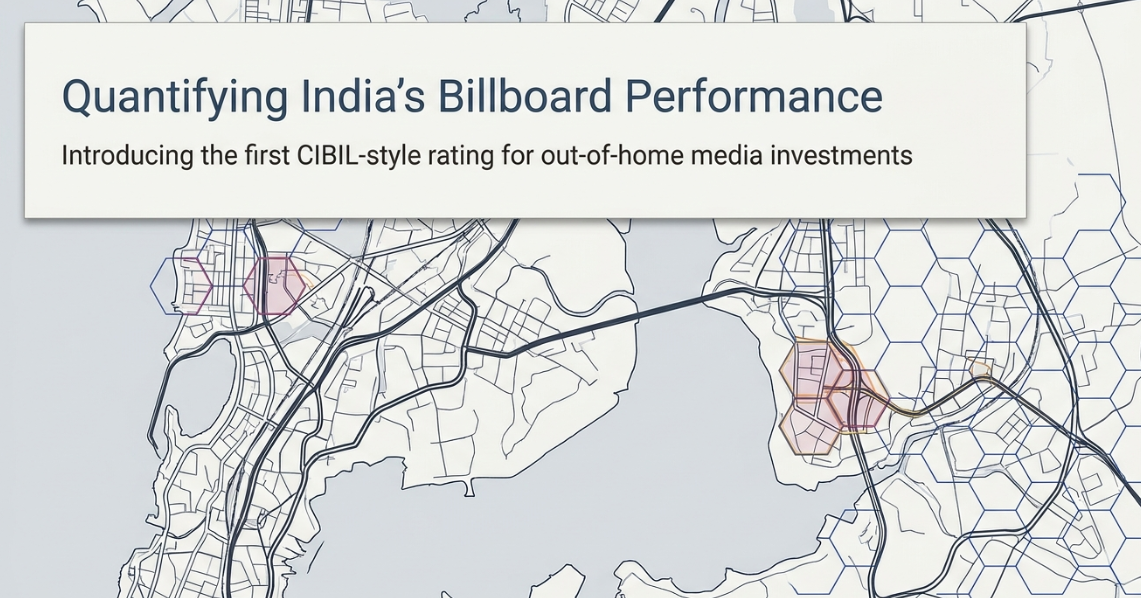
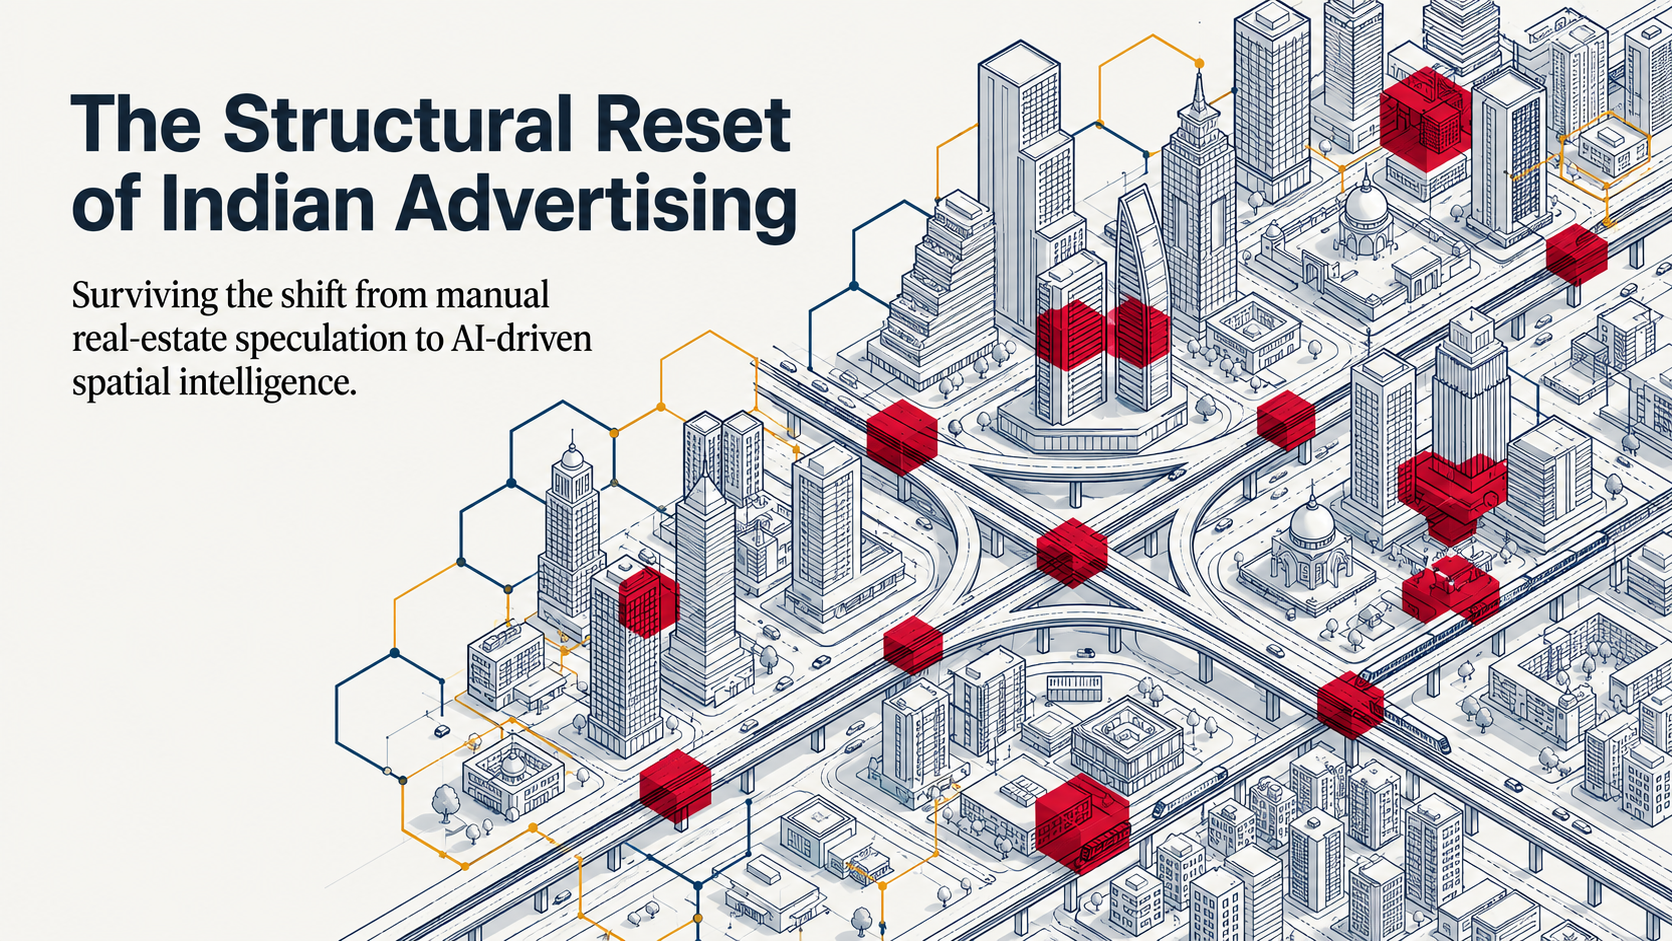
To achieve this, the city grid is mapped using hexagonal cells, each measuring exactly 460 meters on its edge. The hexagonal zones represent independent behavioral units that continuously aggregate movement data, commercial points of interest, and consumer affluence indicators. Within this framework, every physical site inherits its core value from the specific hex in which it sits, providing a highly localized evaluation.
The specific dimensions include the Audience Score for demographic alignment, the Movement Score for dwell time, the Commercial Score for nearby transaction density, and the Intent Score for campaign-specific fit. Our localized approach is transforming billboard quality scoring India wide.
Different brand profiles use customized weights to interpret this spatial data. For instance, a luxury brand prioritizes high-street districts with low movement thresholds, whereas an FMCG brand targets transit corridors with massive coverage breadth. This flexible model secures actual business relevance rather than generic traffic volumes. Rather than treating every passerby identically, the engine filters traffic based on real buying behavior.
Most planners still do not know this.
They continue to treat a high-speed highway billboard and a slow-moving market road identically because the raw vehicle count looks similar on paper. By shifting to a standardized scoring framework, your brand can immediately identify which locations are structurally capable of driving recall.
Our standard rating brings transparency to a category that has historically operated behind a veil of secrecy. When every billboard carries a verifiable score between 300 and 900, planning becomes an objective science. An OOH location rating system allows brands to compare disparate assets with total confidence.
Why supply-side planning dominates and the audit gap hurts brands
The traditional approach to out-of-home media has always been dominated by supply-side lists, where agencies push inventory based on what they have available rather than what your brand actually needs.
Consider a recent real-world campaign where a major banking institution attempted to capture premium credit card sign-ups from affluent corporate professionals commuting through Mumbai. The media agency recommended a massive, high-cost hoarding along the Bandra-Kurla Complex connector in Mumbai, pointing to raw traffic data showing over ten lakh weekly views. Because vehicles move quickly across that open carriageway, the actual exposure time was less than two seconds, resulting in near-zero ad recall. The bank spent lakhs of rupees on a high-prestige site that completely failed to drive web conversions or application downloads.
Had they analyzed the corridor first, they would have realized that a smaller billboard near BKC entry junctions where traffic crawls during peak hours would deliver five times the dwell time. Such a mismatch between raw traffic counts and actual message absorption is where marketing budgets go to die.
Without a standardized metric, the brand was left with no way to audit why their campaign underperformed. They received the typical package of post-campaign photos, a generic compliance certificate, and a bill. The inability to measure offline performance effectively makes overall budget justification incredibly painful.
That is the core failure.
To be direct about something most platforms will not say, full attribution for a static hoarding in a tier-3 city is still genuinely difficult. The data models exist, but the physical ground-truth verification infrastructure in smaller, emerging markets is still catching up. Anyone selling you a complete real-time solution for that specific tier-3 problem is oversimplifying it.
How ADNOXY introduces AI driven billboard performance scoring to India
By establishing a transparent, CIBIL-style rating for physical media assets, the platform allows you to evaluate every billboard location before spending your budget.
The scoring engine treats roads as dynamic behavioral corridors rather than static traffic pipes, modeling how exposure sequencing builds cumulative memory retention. Consequently, you can design campaigns where placements reinforce each other sequentially along a commuter's daily journey, maximizing the return on investment. For every rated asset, the system generates a clear narrative explanation of its exact role, whether it functions as a primary anchor or a commute frequency driver. By replacing subjective agency pitches with a standardized scoring index, your brand can compare different cities and formats with absolute mathematical parity.
We do not sell space; we score it, and when clients first see the hexagonal demand model, the question is almost never about accuracy but rather about which zones their competitor has not covered yet. That simple inquiry changed how we think about the entire platform, prompting us to build deep competitive-tracking layers directly into our rating engine.
Explore the full platform at adnoxy.com. This digital layer is designed to plug directly into your existing media planning workflows to make real-world placements completely auditable. It provides a single source of truth that bridges the gap between digital precision and physical impact.
Nobody talks about this openly.
Data-backed validation and market effectiveness metrics
The financial validation of physical media is becoming incredibly clear as traditional print and television networks struggle to retain their historical audience shares.
According to the FICCI-EY report, the organized out-of-home segment in India recorded a strong 13% growth in 2025, driven by rapid urban expansion and the premiumization of static assets. The commercial expansion highlights how physical presence remains a highly valued asset for brands seeking mass reach in an increasingly fragmented digital world. By applying data-backed analytics, your brand can turn this broad visibility into a highly efficient customer acquisition channel. When you adopt AI driven billboard performance scoring, you gain access to a spatial library of over 50,000 analyzed locations across the country.
A recent study by Nielsen India revealed that outdoor advertisements deliver an 82% ad recall rate, which is the highest of any major media channel. In addition, research by WARC showed that combining physical placements with digital retargeting can lift overall brand recall by an additional 48%.
The listed metrics prove that the physical medium remains highly effective when planned with scientific precision. Our platform achieved an 85% predictive accuracy in campaign performance forecasting for blue-chip partners, leading to its recognition by Inc42 as one of the Top 5 AI Startups To Watch in February 2026. Standardizing your offline media plans with an outdoor media performance index helps protect your budget from speculative agency claims.
And that changes everything about how you plan.
Practical blueprints to modernize your outdoor advertising strategy
To build a highly effective real-world media strategy, your brand must completely stop buying media based on speculative reach metrics.
Stop buying reach; your brand does not have a visibility problem, it has a repetition problem, and most outdoor plans actively make it worse by spreading budgets across disconnected locations. When you scatter single billboards across a dozen different neighborhoods to chase high circulation figures, you fail to achieve the frequency threshold required to register in a consumer's memory. Focus instead on transition zones, the specific urban choke points where audiences shift between workspaces, retail clusters, and residential neighborhoods. For example, the OMR IT corridor in Chennai represents a prime transition zone where daily commuting traffic crawls past tech parks like TCS Siruseri.
Slow-moving traffic creates a high dwell-time window, giving commuters ample opportunity to process your message. By focusing your investment on these high-attention pockets, you build much stronger brand credibility than you would by dominating high-speed expressways.
Next, adopt a multi-role campaign structure where different assets perform distinct strategic functions rather than trying to make every board do everything. Use a large-format PRIMARY_ANCHOR site at major economic hubs to establish market authority, then surround that zone with COMMUTE_FREQUENCY_DRIVER panels on adjacent arterials to reinforce the message daily. Such structured layering builds a cumulative frequency advantage over your competitors.
Here is the part that usually surprises people.
How to evaluate your outdoor campaign with concrete data
I recently sat in a meeting where the marketing head of a scaling direct-to-consumer beverage brand was forced to choose between two competing multi-city OOH proposals.
The first agency presented a traditional, relationship-driven plan filled with massive highway hoardings, boasting of millions of impressions based on static municipal traffic data. The second agency presented a plan backed by spatial intelligence, where every location had been scored for audience alignment, congestion dwell times, and nearby purchasing behavior. When the brand manager asked the first agency to justify why a high-speed highway site in Gurugram was worth ₹1,50,000 per month, the only answer they could provide was that it was a premium spot near a corporate hub. The second agency, using spatial scoring, demonstrated that the highway site had a low movement score due to high transit speeds and instead relocated that budget to signal-controlled junctions near Galleria Market road.
The resulting campaign delivered a 35% higher brand recall and a verifiable 18% lift in store foot traffic within thirty days. By choosing data-driven transparency over vague agency promises, the brand manager turned a speculative budget into a highly predictable growth engine.
Standardizing your media evaluation with concrete metrics allows you to compare the cost efficiency of outdoor formats directly against digital alternatives. When you look at the comparative media efficiency data below, the structural value of high-recall physical assets becomes immediately obvious. Choosing the right platform means securing this level of objective clarity for every rupee spent.
| Media Format |
Cost Per Thousand impressions in INR |
Ad Recall Rate |
Skip or Block Rate |
| Traditional Hoardings |
₹5–₹15 |
82% |
0% |
| Television Commercials |
₹100–₹300 |
62% |
25% |
| Digital Display Ads |
₹50–₹200 |
41% |
65% |
| Social Media Ads |
₹30–₹150 |
38% |
70% |
| Newspaper Print |
₹150–₹500 |
55% |
30% |
Demanding a standardized scoring metric for your out-of-home advertising is no longer a luxury, but a strategic necessity for brands that want to protect their budgets from wasteful guesswork. As Indian cities grow smarter and transit networks continue to expand, the era of buying billboard space based on agency friendships is officially coming to an end. The future of the industry belongs to those who treat real-world spaces as a measurable performance channel, rating and scoring every location before a single rupee moves. By establishing this standard of spatial intelligence today, your brand can turn physical visibility into a highly flexible and expanding, predictable, and auditable science.
Frequently Asked Questions
How does a billboard rating system work in India?
An OOH location rating system evaluates sites by analyzing the surrounding city structure rather than looking at billboards in isolation. ADNOXY divides cities into 460-meter hexagonal demand cells to aggregate localized movement, affluence, and intent signals. This produces an objective score from 300 to 900, giving brands a standardized credit-style rating to evaluate placement quality before committing budgets.
What is the difference between movement scores and traffic counts?
Raw traffic counts merely estimate the total volume of vehicles passing a site, which can be highly misleading on high-speed expressways. A movement score calculated by an outdoor AI tool factors in traffic velocity, congestion levels, and repeat commuter exposure to measure actual visual attention. This ensures your brand pays for real-world message absorption and recall rather than wasted impressions.
How do brand archetypes affect billboard scoring?
An AI OOH platform uses brand archetypes to apply different mathematical weights to the same city data depending on campaign goals. For instance, a luxury brand archetype prioritizes high-street and corporate zones to maintain exclusivity, while an FMCG archetype prioritizes high-speed transit routes for broad coverage. This customized filtering ensures the final score reflects actual business relevance for your specific brand.
Why is the audit gap a problem for outdoor advertisers?
The audit gap refers to the lack of clear, traceable data and performance metrics in traditional out-of-home campaigns compared to digital channels. Brands have historically received nothing more than site photos and speculative traffic estimates from vendors, making ROI defense impossible. Utilizing a standardized rating system helps solve this by providing transparent scores and narrative reasoning for every location.
What are transition zones in outdoor media planning?
Transition zones are specific urban areas where commuter traffic naturally slows down as people move between workspaces, shopping districts, and residential clusters. Billboards in these zones benefit from significant vehicle moderation and signal stops, which increases the dwell time and visual attention window of the audience. ADNOXY models these transition environments explicitly to help brands maximize real-world memory retention.
Works cited
1. OOH Location Scoring: Algorithms to Evaluate Billboard Location Potential in Indonesia, accessed on May 15, 2026, [https://www.lestariads.com/en/blog/ooh/ooh-location-scoring-algorithms-to-evaluate-billboard-location-potential-in-indonesia.html](https://www.lestariads.com/en/blog/ooh/ooh-location-scoring-algorithms-to-evaluate-billboard-location-potential-in-indonesia.html)
2. OOH trends 2026: How the world of OOH Advertising is rewriting the ..., accessed on May 15, 2026, [https://www.socialsamosa.com/guest-post/ooh-trends-2026-ooh-advertising-rewriting-the-rules-11124936](https://www.socialsamosa.com/guest-post/ooh-trends-2026-ooh-advertising-rewriting-the-rules-11124936)
3. How to Measure Out-of-Home Advertising Effectiveness (Beyond Impressions) | BlueAlpha, accessed on May 15, 2026, [https://bluealpha.ai/articles/how-to-measure-out-of-home-advertising](https://bluealpha.ai/articles/how-to-measure-out-of-home-advertising)
4. OOH Advertising Statistics India — 2026 \- Shubindia Ad Works, accessed on May 15, 2026, [https://www.shubindiaadworks.com/outdoor-advertising-statistics-india](https://www.shubindiaadworks.com/outdoor-advertising-statistics-india)
5. Real Estate Ads in Chennai \- Key Statistics & Strategies \- AdSpyder, accessed on May 15, 2026, [https://adspyder.io/blog/real-estate-ads-in-chennai/](https://adspyder.io/blog/real-estate-ads-in-chennai/)
6. India OOH And DOOH Market Size, Share & Forecast Report 2031 \- Mordor Intelligence, accessed on May 15, 2026, [https://www.mordorintelligence.com/industry-reports/india-ooh-and-dooh-market](https://www.mordorintelligence.com/industry-reports/india-ooh-and-dooh-market)
7. OOH Market Forecast 2026 India Growth to ₹8,000 Crore \- Vigyapan Mart, accessed on May 15, 2026, [https://www.vigyapanmart.com/blogs/indian-ooh-market-forecast](https://www.vigyapanmart.com/blogs/indian-ooh-market-forecast)
8. Rethinking Growth: FOCO, OOH and the ROI lens \- BrandEquity, accessed on May 15, 2026, [https://brandequity.economictimes.indiatimes.com/news/media/rethinking-growth-foco-ooh-and-the-roi-lens/130162973](https://brandequity.economictimes.indiatimes.com/news/media/rethinking-growth-foco-ooh-and-the-roi-lens/130162973)
9. Ad Corrector Methodology | Deterministic OOH Ad Testing Without AI, accessed on May 15, 2026, [https://adcorrector.com/methodology](https://adcorrector.com/methodology)
10. OOH Debates Methodology While Advertising Moves On | Billboard Insider™, accessed on May 15, 2026, [https://billboardinsider.com/ooh-debates-methodology-while-advertising-moves-on/](https://billboardinsider.com/ooh-debates-methodology-while-advertising-moves-on/)
11. Billboard Advertising in BKC Connector, Mumbai, accessed on May 15, 2026, [https://acmeadvertiser.com/acme-services/billboard-in-bkc-connector-mumbai/](https://acmeadvertiser.com/acme-services/billboard-in-bkc-connector-mumbai/)
12. Outdoor Advertising Cost in India \- Shubindia Ad Works, accessed on May 15, 2026, [https://www.shubindiaadworks.com/outdoor-advertising-cost-india](https://www.shubindiaadworks.com/outdoor-advertising-cost-india)
13. Billboard Advertising near AIPL Joy Street, Gurugram, accessed on May 15, 2026, [https://acmeadvertiser.com/acme-services/billboard-near-aipl-joy-street/](https://acmeadvertiser.com/acme-services/billboard-near-aipl-joy-street/)
14. OOH Metrics Explained: A Guide to Impressions, Reach, CPM, and More, accessed on May 15, 2026, [https://clearchanneloutdoor.com/blog/ooh-metrics-explained-a-guide-to-impressions-reach-cpm-and-more/](https://clearchanneloutdoor.com/blog/ooh-metrics-explained-a-guide-to-impressions-reach-cpm-and-more/)
15. OOH stands tall among traditional media \- Indian Printer & Publisher, accessed on May 15, 2026, [https://indianprinterpublisher.com/blog/2026/04/ooh-traditional-media/](https://indianprinterpublisher.com/blog/2026/04/ooh-traditional-media/)
16. OOH Defies The Slump, Leads Growth In Traditional Media \- Everything Experiential, accessed on May 15, 2026, [https://everythingexperiential.com/article/ooh-defies-the-slump-leads-growth-in-traditional-media-602225](https://everythingexperiential.com/article/ooh-defies-the-slump-leads-growth-in-traditional-media-602225)
17. Hottest AI Startups In 2026: The Companies Defining The Next Wave Of AI, accessed on May 15, 2026, [https://ashamodernschool.in/hottest-ai-startups-in-2026-the-companies-defining-the-next-wave-of-ai/](https://ashamodernschool.in/hottest-ai-startups-in-2026-the-companies-defining-the-next-wave-of-ai/)
18. OMR Chennai Real Estate Boom 2026: IT Corridor Drives High-Yield Growth & Investment Opportunities, accessed on May 15, 2026, [https://community.verified.realestate/article/omr-chennai-real-estate-boom-2026-it-corridor-drives-high-yield-growth-investment-opportunities/](https://community.verified.realestate/article/omr-chennai-real-estate-boom-2026-it-corridor-drives-high-yield-growth-investment-opportunities/)
19. Digital OOH Advertising In Chennai \- The Media Ant, accessed on May 15, 2026, [https://www.themediaant.com/outdoor?location=Chennai%2C%20Tamil%20Nadu%2C%20India\&locationId=ChIJYTN9T-plUjoRM9RjaAunYW4\&mediaTypes=Digital%20OOH\&sortBy=views](https://www.themediaant.com/outdoor?location=Chennai,+Tamil+Nadu,+India&locationId=ChIJYTN9T-plUjoRM9RjaAunYW4&mediaTypes=Digital+OOH&sortBy=views)
20. OOH Advertising India – Guide 2026 \- Shubindia Ad Works, accessed on May 15, 2026, [https://www.shubindiaadworks.com/outdoor-advertising-india](https://www.shubindiaadworks.com/outdoor-advertising-india)
21. Billboard marketing in Galleria Market Road gurugram \- Acme Advertising Co., accessed on May 15, 2026, [https://acmeadvertiser.com/acme-services/billboard-marketing-in-galleria-market-road-gurugram/](https://acmeadvertiser.com/acme-services/billboard-marketing-in-galleria-market-road-gurugram/)
22. OOH Performance Measurement \- Reveal, accessed on May 15, 2026, [https://revealmobile.com/solutions/measurement](https://revealmobile.com/solutions/measurement)