Deploying predictive AI analytics OOH advertising has become the baseline operational requirement for prominent Indian brands that refuse to lose their hard-earned marketing budgets to unverified vendor pitches. Every fiscal year, millions of marketing rupees are wasted on poorly placed outdoor campaigns because traditional media buyers cannot forecast true consumer recall before signing the financial booking contract. In a highly competitive national media ecosystem where every channel is held accountable, committing advertising capital without verified spatial and attention metrics is an unnecessary risk that modern corporate brands no longer need to take.
This planning shift has reached a critical peak in 2026 as India's advertising expenditure expands to ₹1,74,605 crore under the pressure of hyper-local consumption and quick-commerce scaling. With digital media now capturing an absolute 64% share of total ad spend, traditional channels must prove their performance metrics or risk being excluded from modern omni-channel budgets entirely. Out-of-Home is emerging as the unique survivor of this traditional contraction, projected to grow by 5% to ₹5,077 crore this year. Brands are actively diverting budgets from expensive digital performance streams into highly targeted physical spaces, demanding programmatic verification before they execute.
How predictive AI analytics OOH advertising changes campaign planning
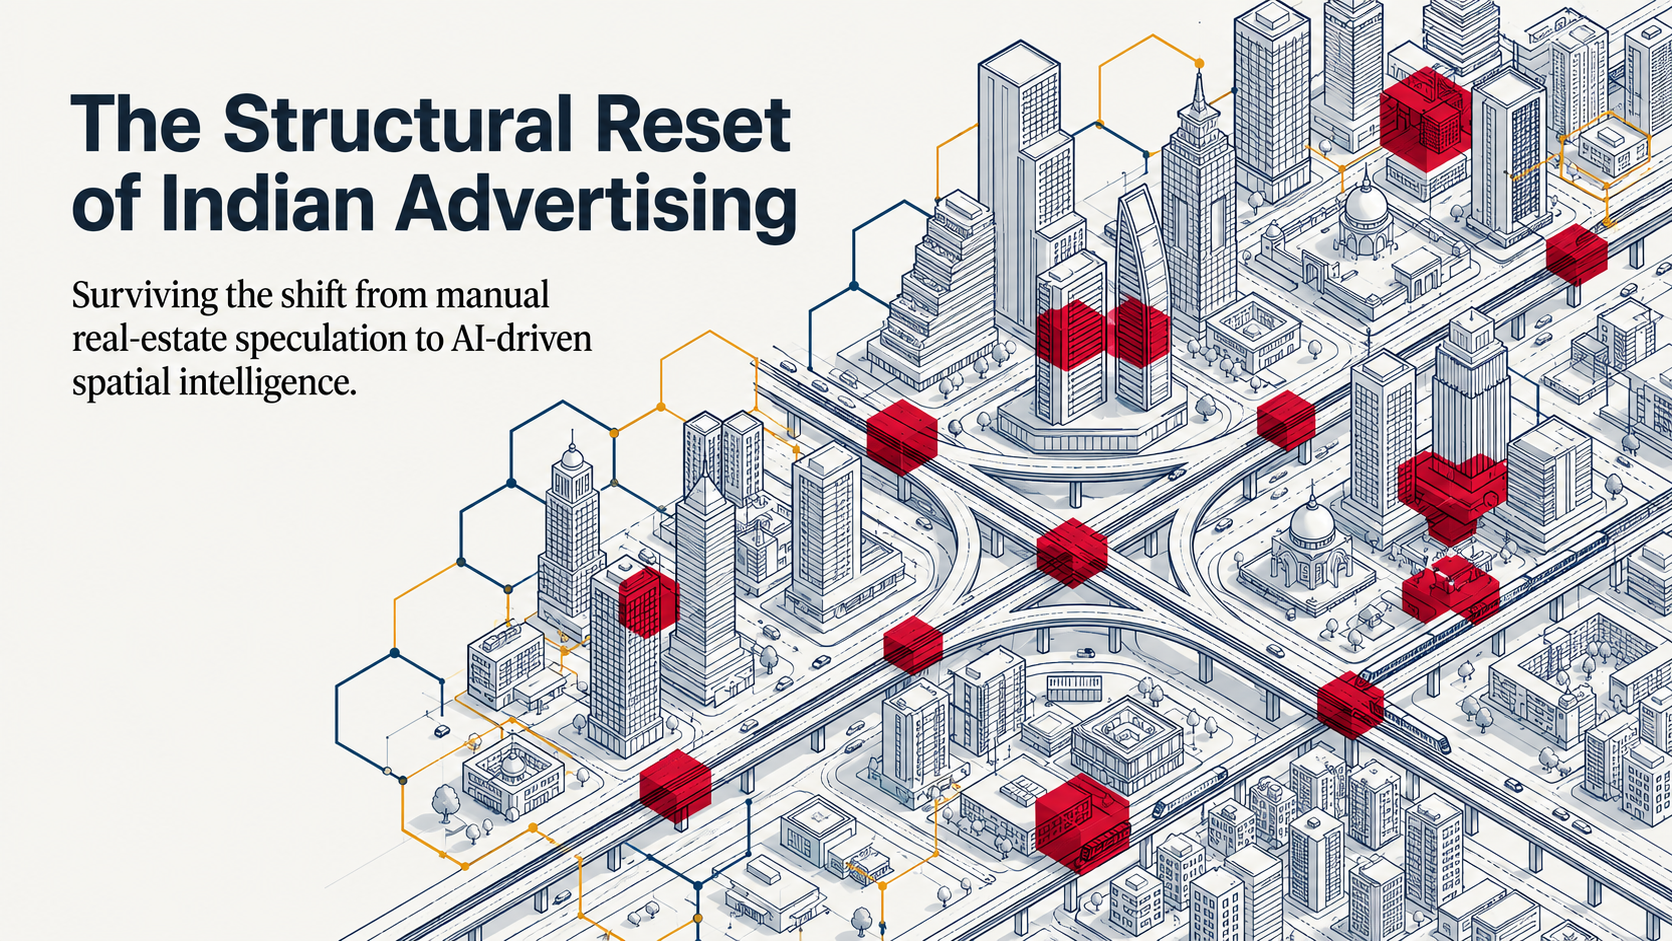
The core architecture of predictive outdoor planning relies on treating cities as living spatial systems rather than static maps. Rather than using site-first planning—where an agency selects a billboard simply because a media owner has it available—the system begins by mapping how a city moves and where specific audience segments spend their day. This spatial mapping allows us to determine the Opportunity To See (OTS), which measures the raw number of times a commuter has a physical chance to view a billboard.
Rather than relying on this raw baseline, the engine calculates the Visibility Adjusted Contact (VAC), which adjusts the estimate to show the actual number of people who look directly at the ad based on physical angles and vehicle speed. This calculation is run across a hexagonal grid where each cell represents an area with a 460-meter edge length.
The platform deploys propensity scoring—a statistical method that estimates the likelihood of a specific audience demographic visiting a retail store after exposure—to evaluate the commercial fit of each cell. The scoring model also balances the Audience Score for demographic alignment, the Movement Score for dwell time, and the Intent Score for brand archetypes. These factors feed into a centralized location-reasoning model that standardizes the rating of every physical asset. Media planners can now compare completely different cities using a unified evaluation standard that functions like a financial risk rating.
Most planners still do not know this.
The flyover illusion and the physics of commuter attention
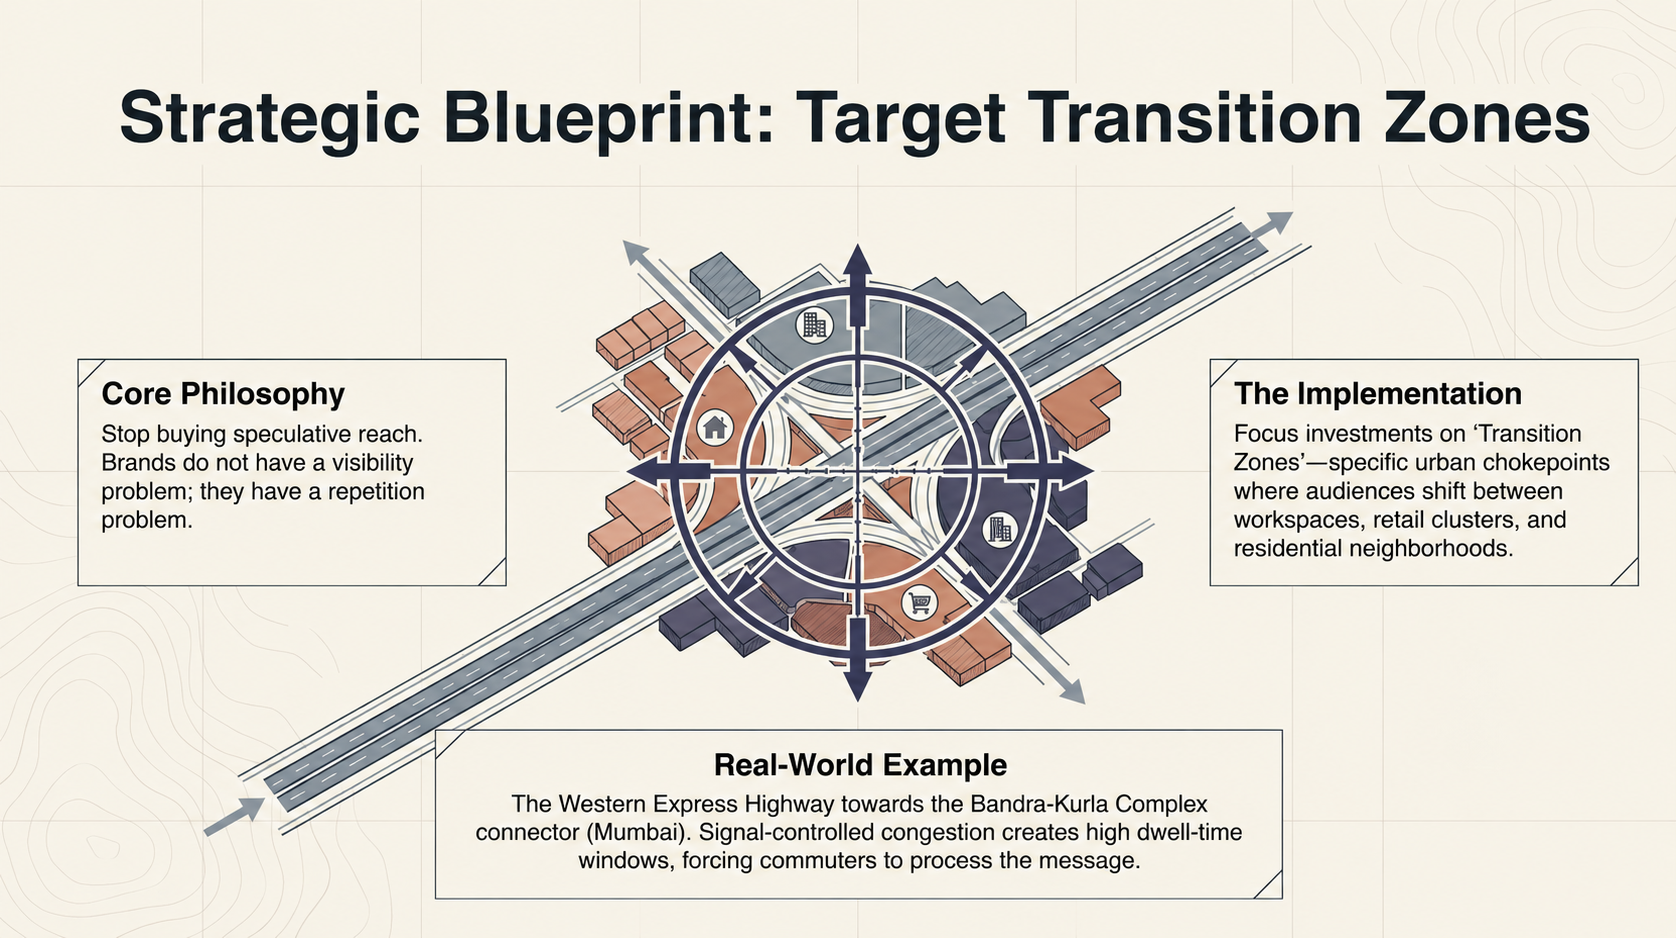
Vast traffic numbers on a vendor's proposal frequently hide the true cost of invisible impressions. Planners often assume that placing an ad on a busy arterial like the Western Express Highway in Mumbai—which carries over four lakh vehicles daily—guarantees massive brand recall. A high-profile premium launch recently wasted lakhs on a massive flyover unipole near Bandra, only to see near-zero brand lift because vehicles passed the site at 70 kilometers per hour.
To be direct about something most platforms will not say — full attribution for a static hoarding in a tier-3 city is still genuinely difficult. The physical tracking networks and high-fidelity mobile telemetry that feed our urban models simply do not exist with the same density in smaller regional markets. Anyone selling you a flawless, real-time attribution solution for a standard board in a remote town is oversimplifying a highly complex problem. In those emerging zones, we rely on baseline historical demographic data rather than live movement feeds to build our spatial projections.
This visibility gap is why traditional campaigns often fail to establish any verifiable connection between media spend and business results. Because static billboards have a limited viewing window of three seconds for transit audiences, poor placement choices inevitably lead to zero message absorption.
That is the core failure.
Translating spatial data into auditable media strategies
Our spatial intelligence engine transforms physical spaces into structured, measurable media channels. Instead of acting as an inventory listing site, the platform uses automated decision workflows to match your campaign objectives against actual consumer movement patterns. This systematic approach guarantees that every selected billboard has a verified structural role, such as acting as a PRIMARY_ANCHOR or a COMMUTE_FREQUENCY_DRIVER.
We do not sell space; we score it. When we first built our spatial scoring model, clients did not ask about our technical details — they only wanted to see the blind spots where their competitors were completely absent. That industry insight forced us to redesign our software around competitor profiling and tactical isolation. Explore the full platform at adnoxy.com.
By focusing on corridor intelligence, the system evaluates how roads function as connected behavioral systems rather than simple traffic pipes. Planners can sequence creatives across a commuter's daily path, building a cumulative memory effect that single, isolated boards cannot replicate.
Nobody talks about this openly.
Empirical evidence of forecasting accuracy in Indian metros
Deploying predictive AI analytics OOH advertising has allowed leading consumer brands to achieve verified efficiency gains across volatile urban markets. According to the Pitch Madison Advertising Report 2026, outdoor media spends have reached ₹5,077 crore, driven entirely by the demand for programmatic transparency and dynamic digital screen networks. This shift is backed by our database of over 50,000 physical locations across India, delivering a documented 85% predictive accuracy rate in campaign performance forecasting.
In parallel, a comprehensive market study by Mordor Intelligence reveals that while traditional static boards still capture 67.30% of outdoor revenue, digital formats are expanding at a rapid 6.95% annual growth rate through 2031. The same report highlights that transit media formats are outperforming standard billboards with an 8.05% projected growth rate, as commuter networks expand across tier-1 cities. These figures demonstrate why major enterprise spenders like Tata, Axis Bank, and Nestlé have integrated spatial analytics directly into their procurement pipelines. Our spatial databases provide the foundation for outdoor advertising prediction India across top metro corridors.
This standardized measurement layer has changed outdoor advertising from a speculative branding exercise into a performance-driven conversion channel. As one media planner put it: "We stopped trusting gut feel the day ADNOXY showed us the data."
And that changes everything about how you plan.
Actionable guidelines for modern media buyers
To optimize your physical media campaigns, you must completely abandon raw traffic volume as your primary metric. Reach is too easily inflated on major arterials where commuters pass high-speed boards without any cognitive recall. Stop buying reach; your brand does not have a visibility problem, but a repetition problem that most plans actively make worse by spreading budgets across disconnected spots.
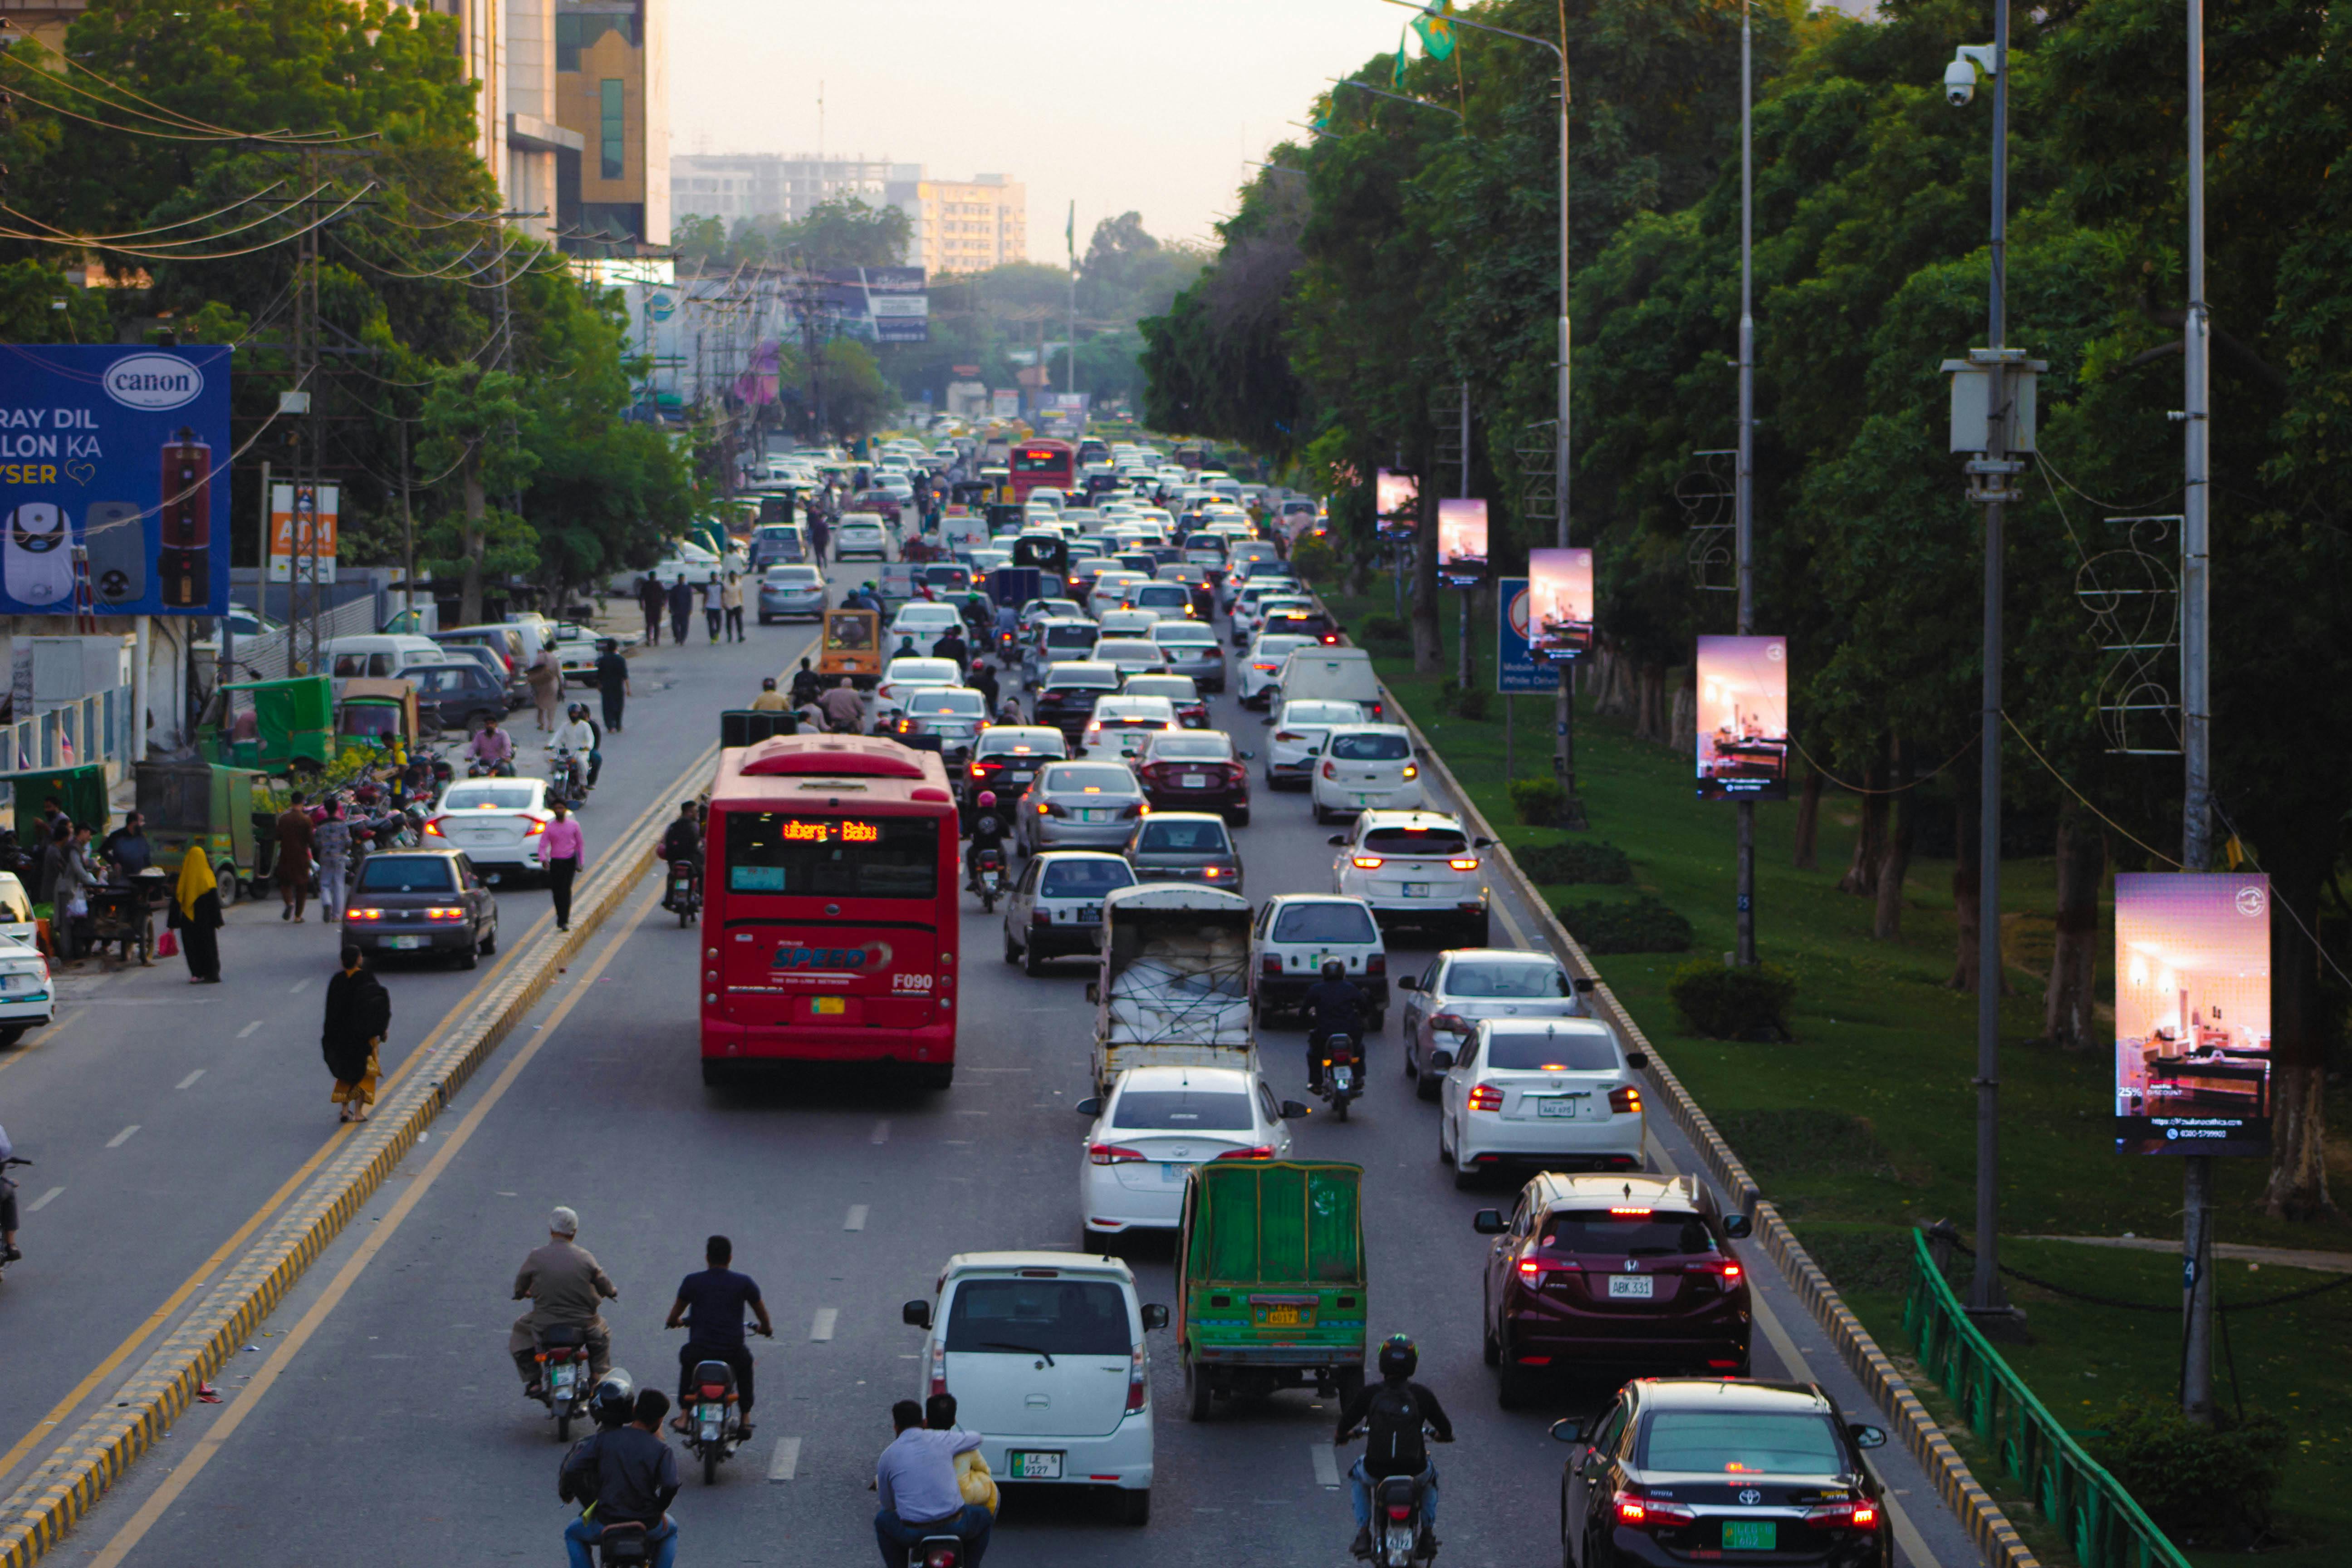
Effective physical campaigns require securing a minimum frequency of three to five exposures per unique commuter to build a lasting memory. This is particularly true in geographically concentrated markets like Mumbai, where three crore commuters are funneled through just three primary corridors. Placing consecutive, smaller boards along the Western Express Highway or LBS Marg delivers a forced-repetition effect that achieves recall rates 40% higher than scattered city-wide campaigns. If your budget is limited, you should sacrifice geographic reach entirely to guarantee high-frequency coverage along a single, high-dwell route.
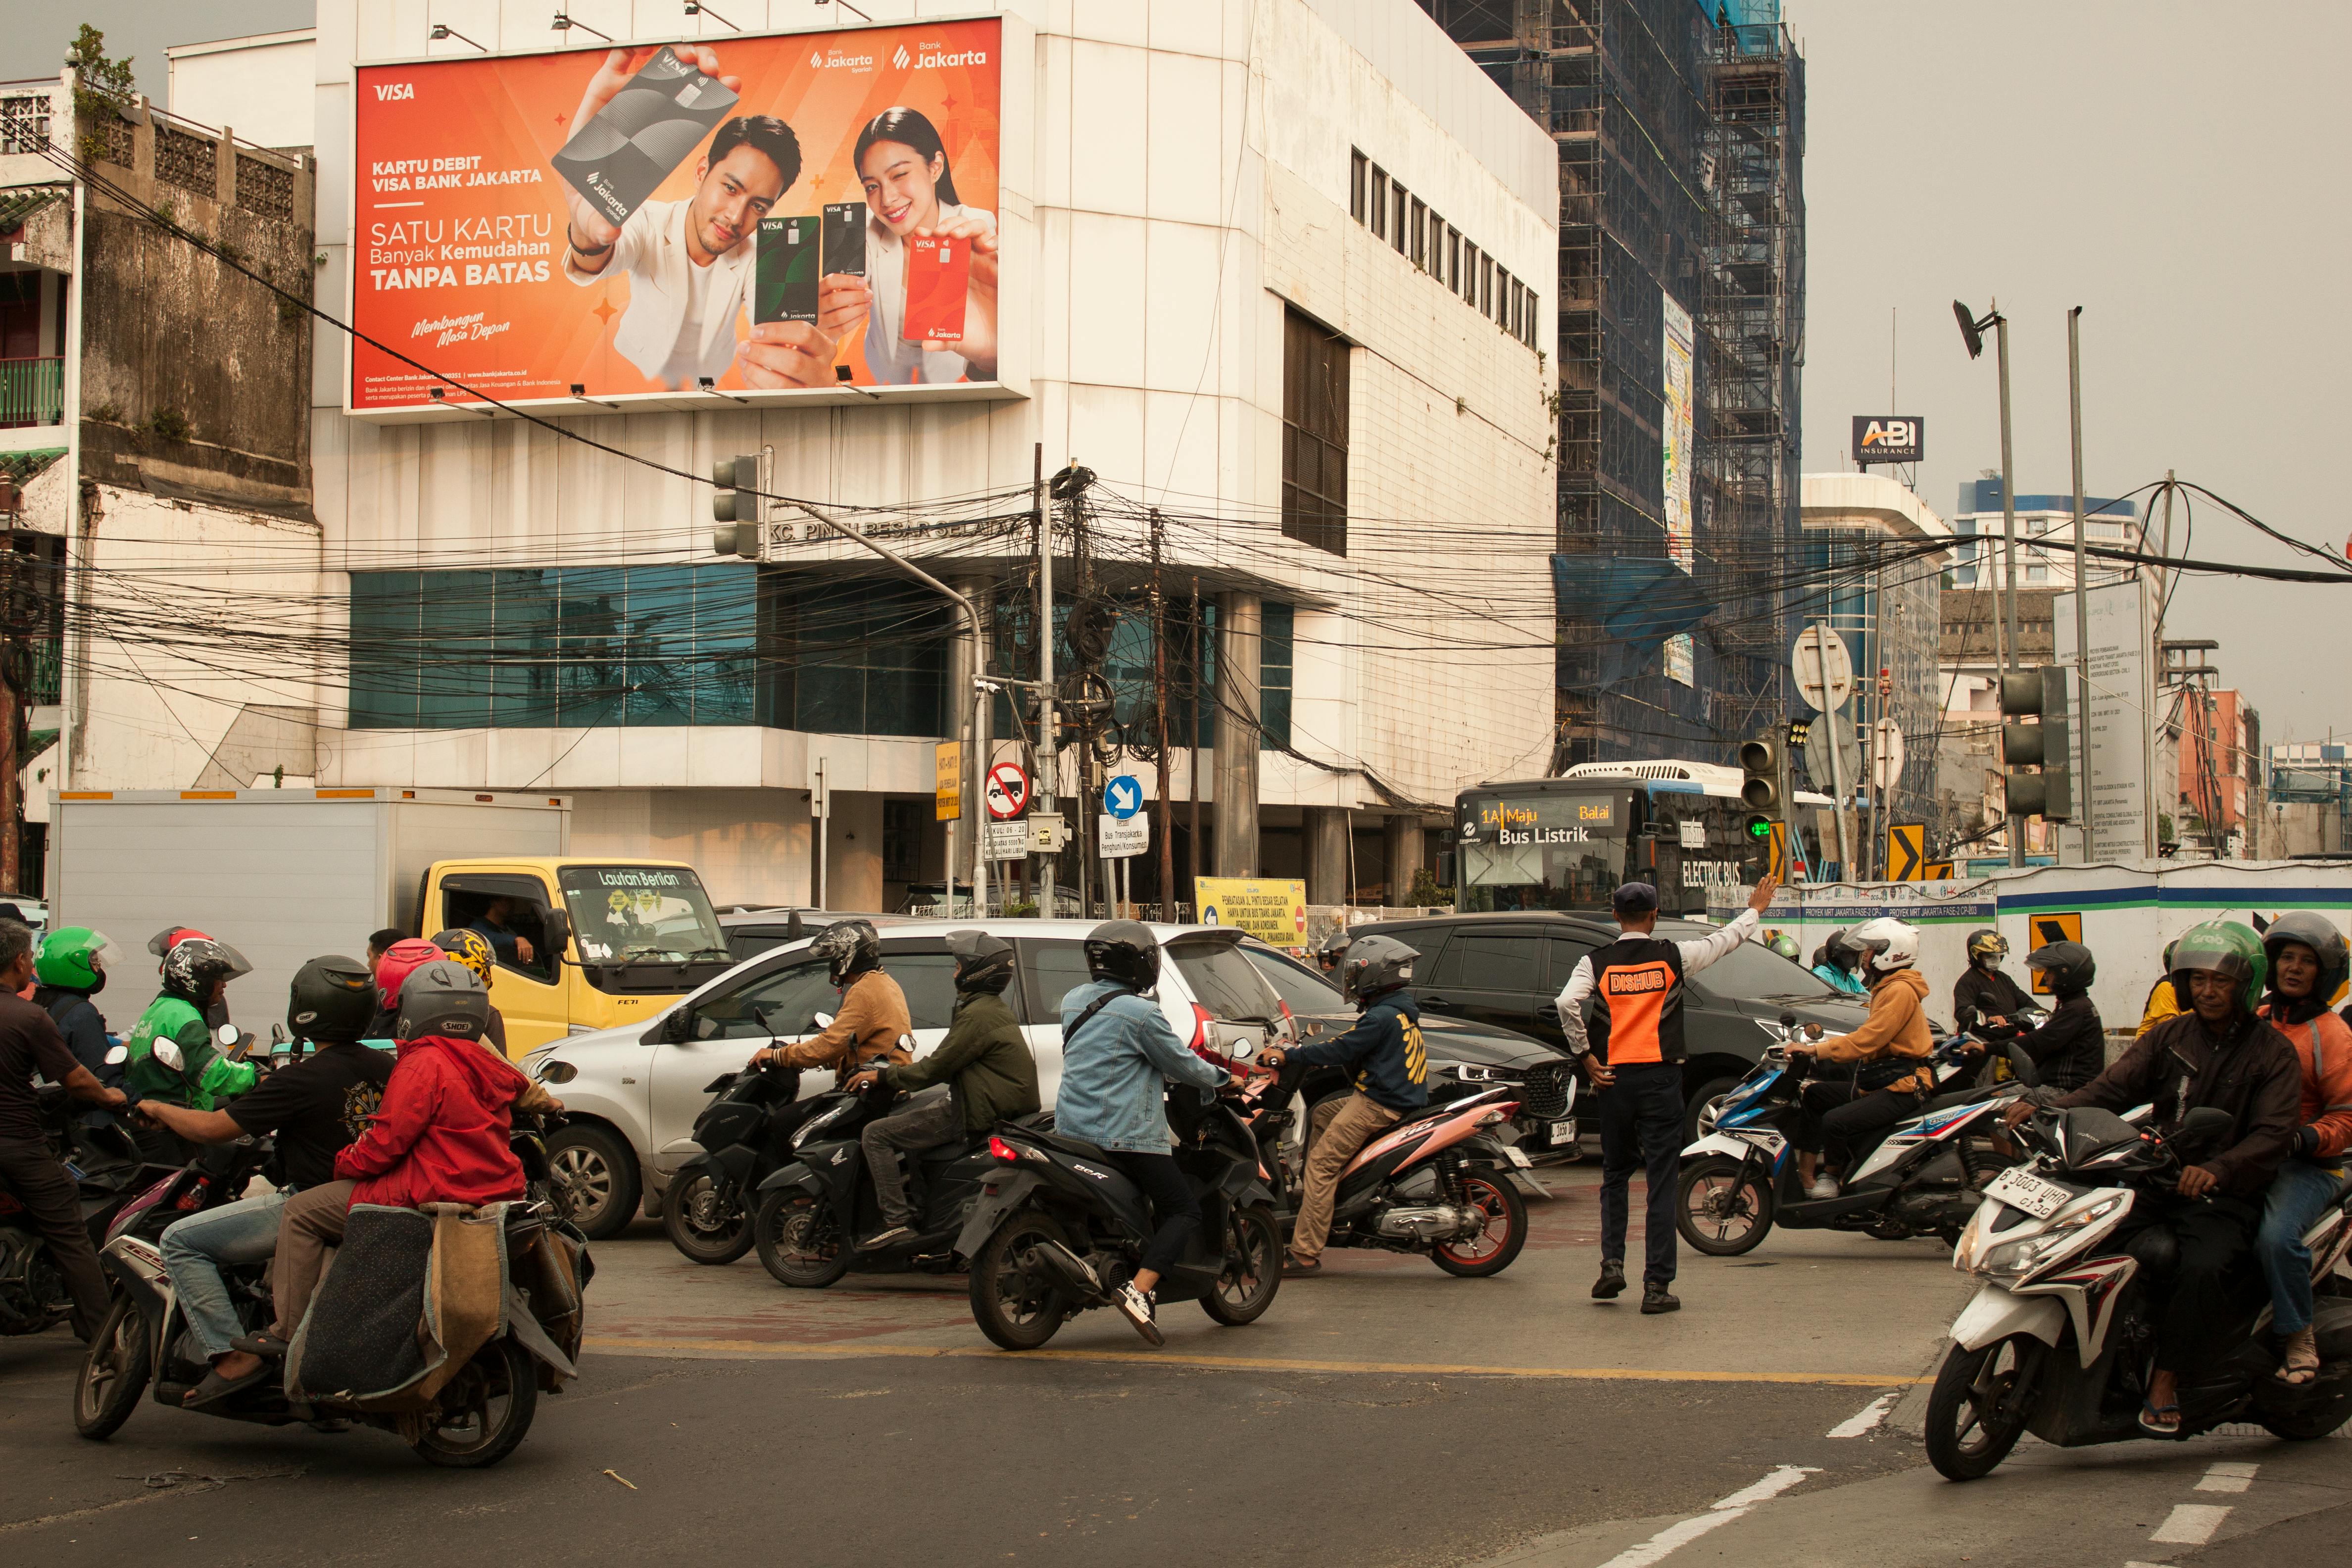
When scouting premium sites like the DND Flyway in Delhi, look for boards positioned near merge lanes or toll plazas where vehicles naturally decelerate. These slow-moving zones dramatically expand the visual absorption window, giving commuters the necessary time to read and remember your brand message.
Here is the part that usually surprises people.
Evaluating location value through concrete performance metrics
Procurement teams routinely reject highly effective outdoor plans because they evaluate locations using static cost-per-square-foot metrics. Consider a recent scenario where a fast-growing digital banking brand wanted to launch its services across South Delhi and Noida. The internal procurement team insisted on buying a network of cheap pole kiosks spread across multiple disconnected residential sectors.
By running a spatial evaluation, the marketing team demonstrated that their professional target audience was concentrated along the Noida-Greater Noida Expressway during peak hours. Moving the budget to a single gantry near Sector 135 captured these high-income commuters when they were stationary in slow-moving corporate traffic. This decision, despite having a higher face cost, delivered triple the direct website visits compared to the scattered kiosk campaign. It proved that purchasing high-dwell attention is far more cost-effective than buying low-cost, invisible impressions.
To guide your procurement evaluations, we have compiled the baseline cost and performance metrics across India's most strategically valuable corridors. These benchmarks highlight why buying physical space must be treated as an exercise in measuring audience attention rather than buying raw physical dimensions.
| Corridor or Format |
Average Daily Traffic |
Unique Monthly Reach |
Estimated Monthly Cost |
| Western Express Highway Mumbai |
400000 vehicles |
1000000 people |
₹500000 – ₹1000000 |
| DND Flyway Delhi |
300000 vehicles |
1050000 people |
₹80000 – ₹350000 |
| Bandra Worli Sea Link Approach |
40000 vehicles |
900000 people |
₹400000 – ₹800000 |
| Bengaluru Outer Ring Road |
150000 vehicles |
800000 people |
₹70000 – ₹250000 |
| Standard Metros Static |
100000 vehicles |
500000 people |
₹100000 – ₹500000 |
| Premium Digital Metros |
200000 vehicles |
1200000 people |
₹300000 – ₹2500000 |
Conclusion
Marketing executives who continue to plan their physical campaigns using legacy methods will find themselves unable to defend their budgets in an increasingly performance-driven corporate environment. The transition toward rating-grade spatial intelligence is already underway, forcing the entire OOH sector to adopt the same precision as the digital ecosystem. Your brand must choose whether to lead this analytical shift or continue spending millions on invisible highway impressions that generate no verifiable return.
Frequently Asked Questions
How do marketing teams forecast outdoor campaign results in India?
Forecasters deploy spatial intelligence models to analyze how traffic moves through urban arterial corridors. By integrating mobile location telemetry with local point-of-interest data, the system predicts the visual exposure rate for specific demographics before any booking occurs. Our database of over fifty thousand physical spots provides the historical baseline to run these campaign simulations with high accuracy.
What is the ideal exposure frequency for a billboard campaign in Mumbai?
To secure lasting brand recall in highly congested metros, your campaign should target a baseline frequency of three to five exposures per unique commuter. Mumbai's linear geography naturally supports this strategy because three crore daily commuters are funneled through just three primary highways. Concentrating your budget on these specific chokepoints builds the necessary repetition far more effectively than a scattered city-wide deployment.
How does traffic speed affect the value of an outdoor advertising location?
Vehicles traveling at high speeds on flyovers or expressways reduce the visual absorption window to under two seconds, which makes complex brand messages unreadable. Locations with slow-moving traffic, signal stops, or merge lanes are far more valuable because they provide extended dwell times for brand interaction. Our spatial scoring models explicitly lower the valuation of high-speed transit spots to protect brands from paying for invisible impressions.
Can brands measure the return on investment of static billboards?
Yes, brands can evaluate physical campaign effectiveness by geofencing their billboard locations and tracking subsequent foot traffic to physical retail stores or direct website visits. By establishing a clear performance baseline before launch, you can isolate the specific lift driven by your outdoor placements. Our proprietary platform offers structured campaign verification reports that bring digital-style accountability to physical media.
Why do corporate procurement teams struggle to evaluate outdoor ad plans?
Procurement departments often default to cost-per-square-foot metrics because they lack a standardized system to measure and compare real audience engagement. This cost-only approach encourages price undercutting rather than optimizing for effective impressions, frequently leading to underperforming campaigns. Deploying ratings-grade spatial analytics allows buying teams to shift their focus from raw physical dimensions to verified attention value.