AI billboard audience analytics has evolved from a premium technology demonstration into a critical operational necessity for modern marketing teams seeking verifiable offline campaign performance across dense Indian metros. Brand managers consistently lose millions of rupees on unverified offline campaigns because traditional OOH measurement frameworks remain heavily indexed to legacy traffic counts that fail to capture exposure speed. To establish true financial accountability in a competitive market where every rupee must justify its output, your brand must transition from speculative placements to data-backed spatial decisions.
According to the comprehensive Pitch Madison Advertising Report 2026, the Indian advertising market scaled to an unprecedented ₹1,55,105 crore in 2025, driven heavily by hyper-local commercial demand. While linear television spends remained completely flat and conventional print struggled to capture youth mindshare, digital formats expanded aggressively to represent a dominant 60% of the entire advertising ecosystem. Out-of-Home advertising has adapted to this shifting environment by emerging as the only traditional medium growing in absolute value, driven largely by the programmatic capabilities and creative flexibility of modern digital screens. Your brand can no longer afford to evaluate high-budget physical placements using the outdated, relationship-driven frameworks of the legacy media era.
Decoding the Spatial Framework of Location Scoring
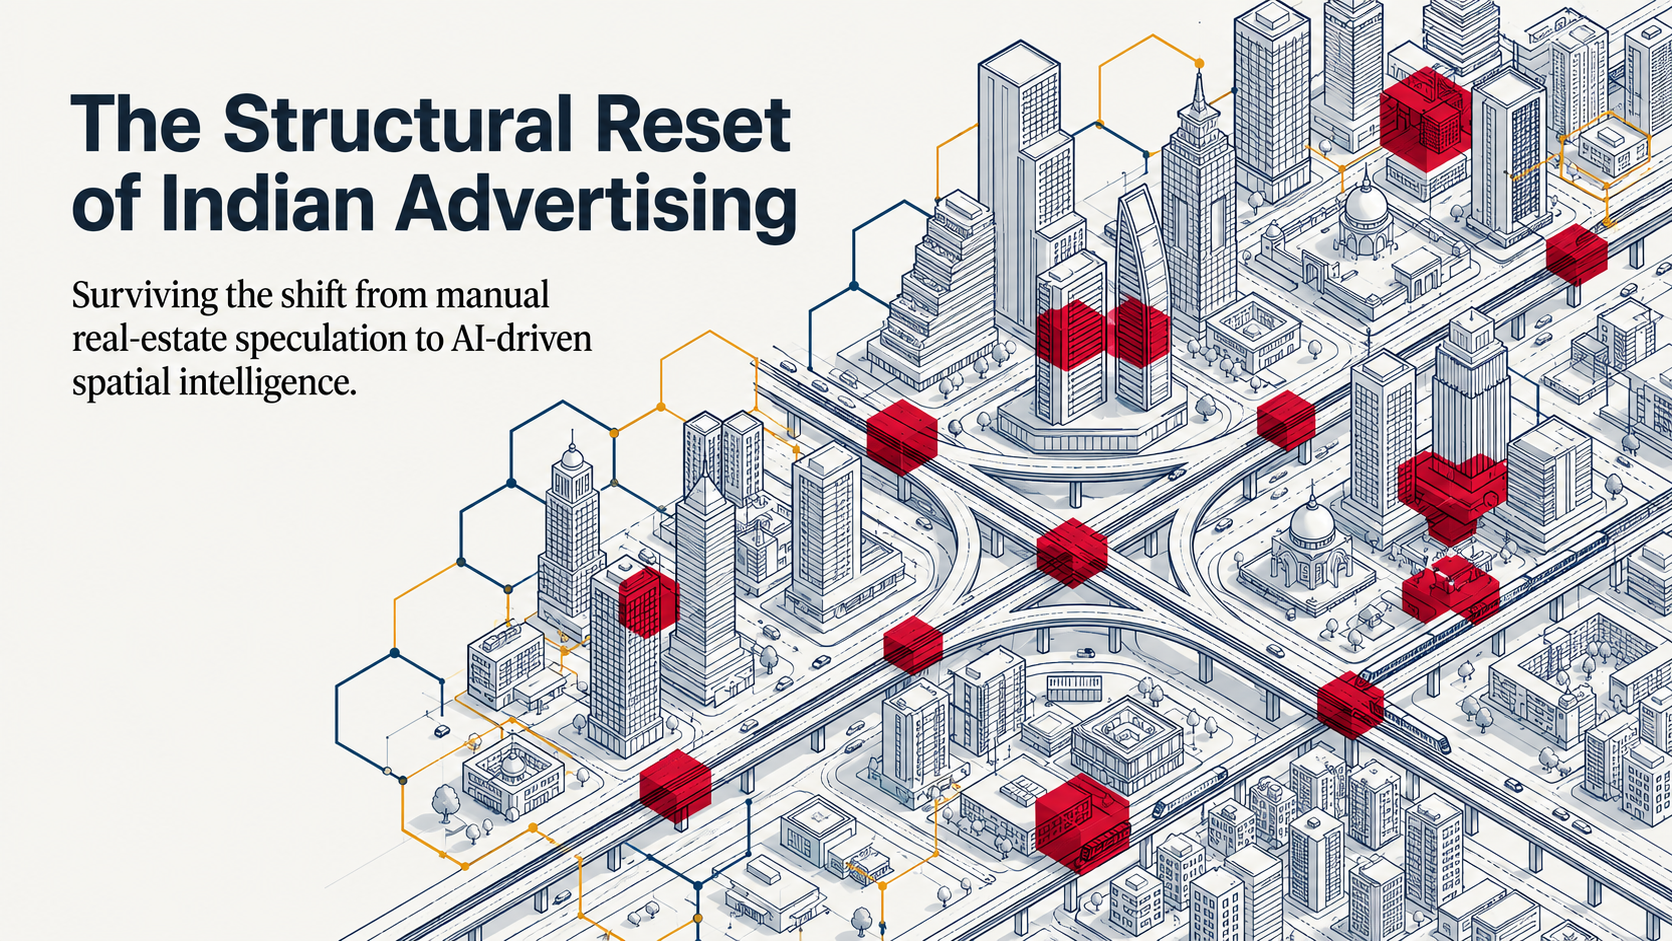
Modern spatial intelligence platforms do not look at cities as collections of isolated billboards, but as complex networks of human movement. The outdated method of placing subjective pin-drops on a physical map has been replaced by a city-first evaluation method that maps how neighborhoods connect and where corridors of commercial interest dominate. Every individual asset inherits its strategic value from the broader urban structures and daily behavioral patterns surrounding it rather than existing as an independent site with arbitrary pricing.
Urban planning logic now dictates commercial advertising value across every major tier-1 city.
The foundation of this spatial logic rests on dividing a city into tight hexagonal cells with an edge length of approximately 460 meters. Every individual cell becomes an active behavioral unit where mobile location data, point-of-interest density, and regional affluence data are continuously aggregated to model audience flow.
To evaluate these cells, the system deploys a comprehensive four-dimensional scoring model. The audience score measures how well a zone aligns with specific consumer profiles, while the movement score evaluates repeat exposure and daily commute conditions. Commercial viability is calculated through the commercial score, which maps the active retail environment around each spot. Finally, the intent score determines if the zone matches the campaign's specific brand archetype, such as luxury, FMCG, or real estate.
Most planners still do not know this.
The Flyover Illusion and the Core Defect in Traffic Metrics
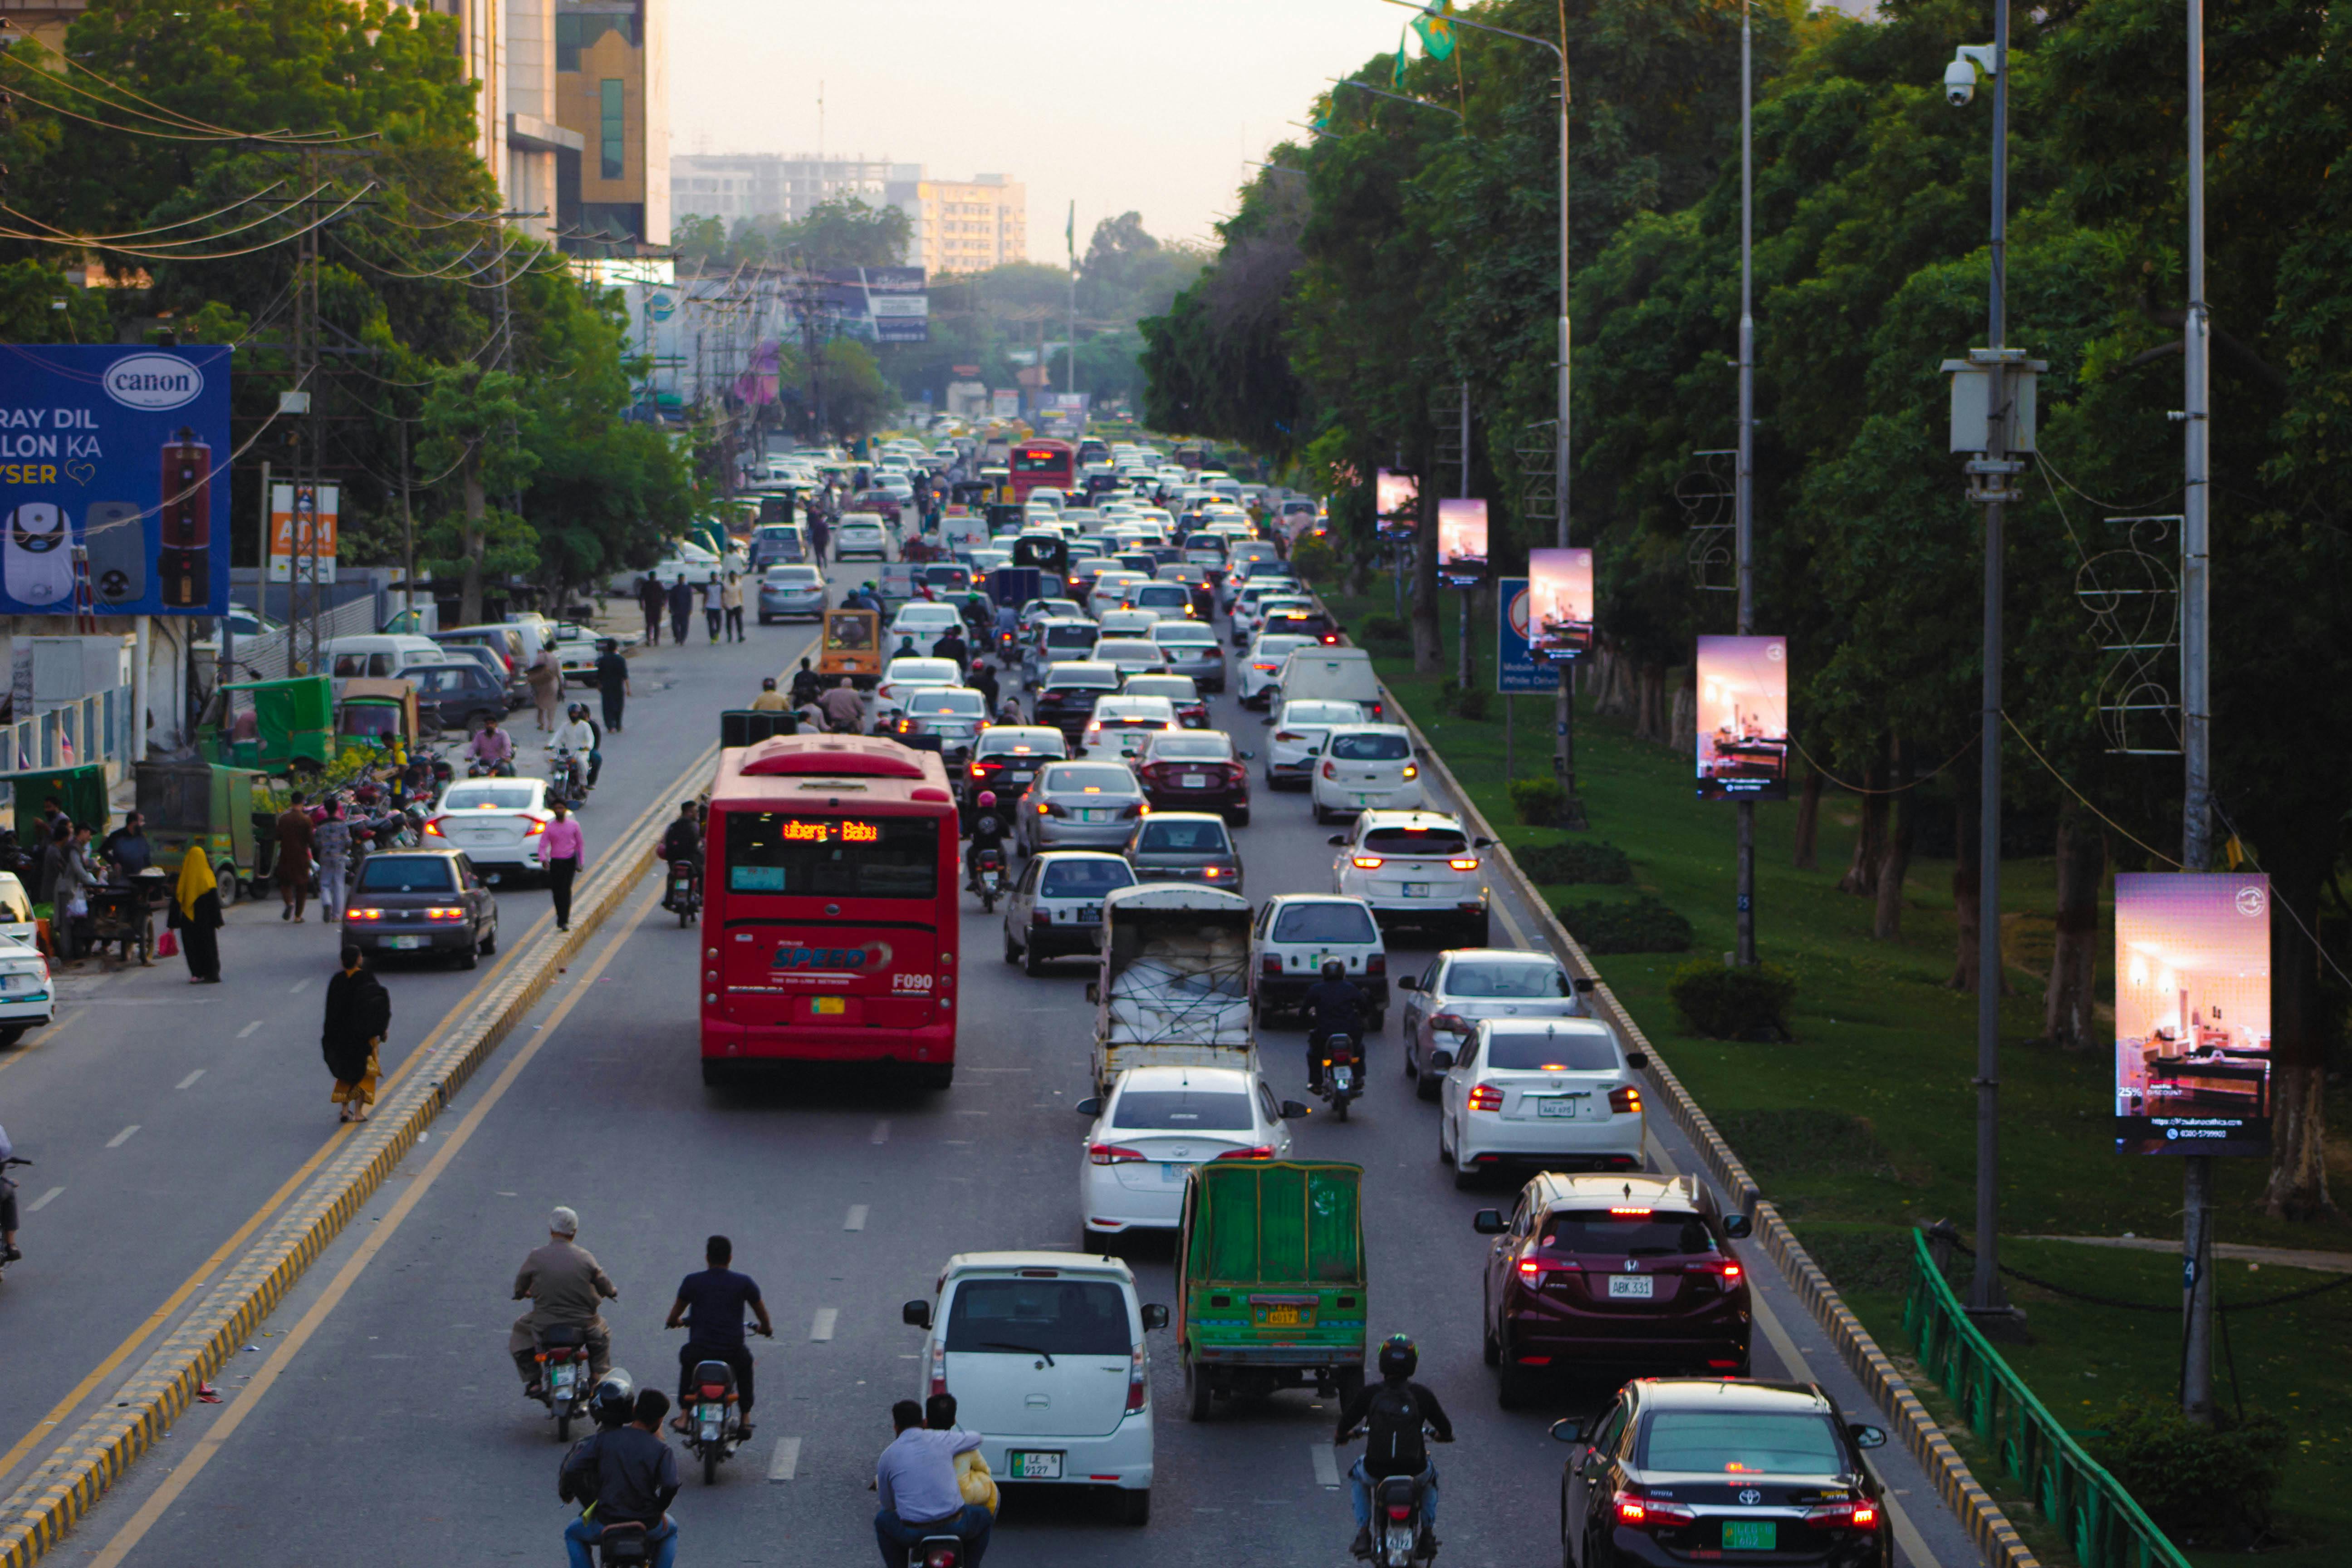
When you buy outdoor media based solely on traffic volume, you are often paying for impressions that yield zero brand recall. This issue is particularly visible on the Western Express Highway in Mumbai, a high-traffic arterial that handles over four lakh vehicles daily on the Bandra-Andheri stretch. A premium automotive brand recently launched a major campaign on a massive flyover hoarding along this route, expecting unmatched visibility but achieving near-zero visual engagement because of high-speed transit.
The campaign underperformed because vehicles travel across that flyover at high speeds, shrinking the visual absorption window to under two seconds. In contrast, a nearby arterial road with slower movement and a signal-controlled junction achieved double the recall rates despite having half the traffic volume.
Nobody talks about this openly.
The truth is that our industry has a baseline measurement problem. To be direct about something most platforms will not say — full attribution for a static hoarding in a tier-3 city is still genuinely difficult. The data exists, and the models are maturing, but the ground-truth verification infrastructure in smaller markets is still catching up. Anyone selling you a complete solution for that specific problem is oversimplifying it.
Transforming Outdoor Media with Standardized Location Scoring
We solve this systemic opacity by operating like a spatial rating agency rather than a traditional media vendor. The system provides clear billboard location scoring so every physical spot can be verified before marketing budgets are committed. By using structured data instead of human intuition, your team can construct media plans where every single location has a specific, auditable role.
We do not sell space; we score it. When clients first see our hexagonal model, the question is almost never about mathematical accuracy — it is always about which specific zones their competitors have left uncovered.
That is the core shift.
Instead of choosing boards based on relationships, you can deploy corridor intelligence to sequence exposures along a commuter's daily route. A commuter traveling from Noida Sector 135 across the DND Flyway encounters specific, sequenced boards that build cumulative memory effects. This structured approach reduces waste by focusing only on high-dwell areas where your target audience actually concentrates. Explore the full platform at adnoxy.com.
Validating AI Billboard Audience Analytics with Hard Data
Hard market data confirms that the demand for verifiable physical media metrics has reached a critical peak. According to the Pitch Madison Advertising Report 2026, outdoor advertising budgets grew to ₹5,077 crore in 2026, marking a steady 5% expansion in a year when other traditional formats remained completely stagnant. This expansion is driven by the rapid adoption of digital out-of-home screens, which Mordor Intelligence projects will expand at a compound annual growth rate of 6.95% through 2031.
These systems are backed by extensive coverage, with our intelligence platform monitoring over 50,000 distinct locations across India. By integrating location data with telco pings, we achieve an 85% predictive accuracy rate in campaign performance forecasting.
The impact of this database is recognized across the industry. For instance, Inc42 featured our platform as one of India's Top 5 AI Startups to Watch in February 2026, highlighting the shift toward structured offline advertising metrics. Major global brands including Tata, Axis Bank, Nivea, and Nestlé now deploy these models to justify their OOH spending before launching multi-city campaigns. This structured validation has helped transition outdoor media from a speculative brand-building exercise into an auditable performance channel.
And that changes everything about how you plan.
Actionable Strategies for Modern Media Buyers
If you want to stop wasting your marketing budget, you must stop buying reach as your primary campaign metric. Reach is a deceptive, inflated figure in dense metros like Mumbai and Delhi where millions pass a board without ever looking at it. Instead, your planning must focus on effective frequency, deploying outdoor audience profiling India to identify where your ideal consumer actually dwells.
The contrarian reality that most agencies hide is that a single premium billboard is often a waste of capital compared to multiple smaller placements along a single commuter corridor. By concentrating your budget on a specific path, you build the necessary repetition threshold of three or more exposures required to secure mindshare.
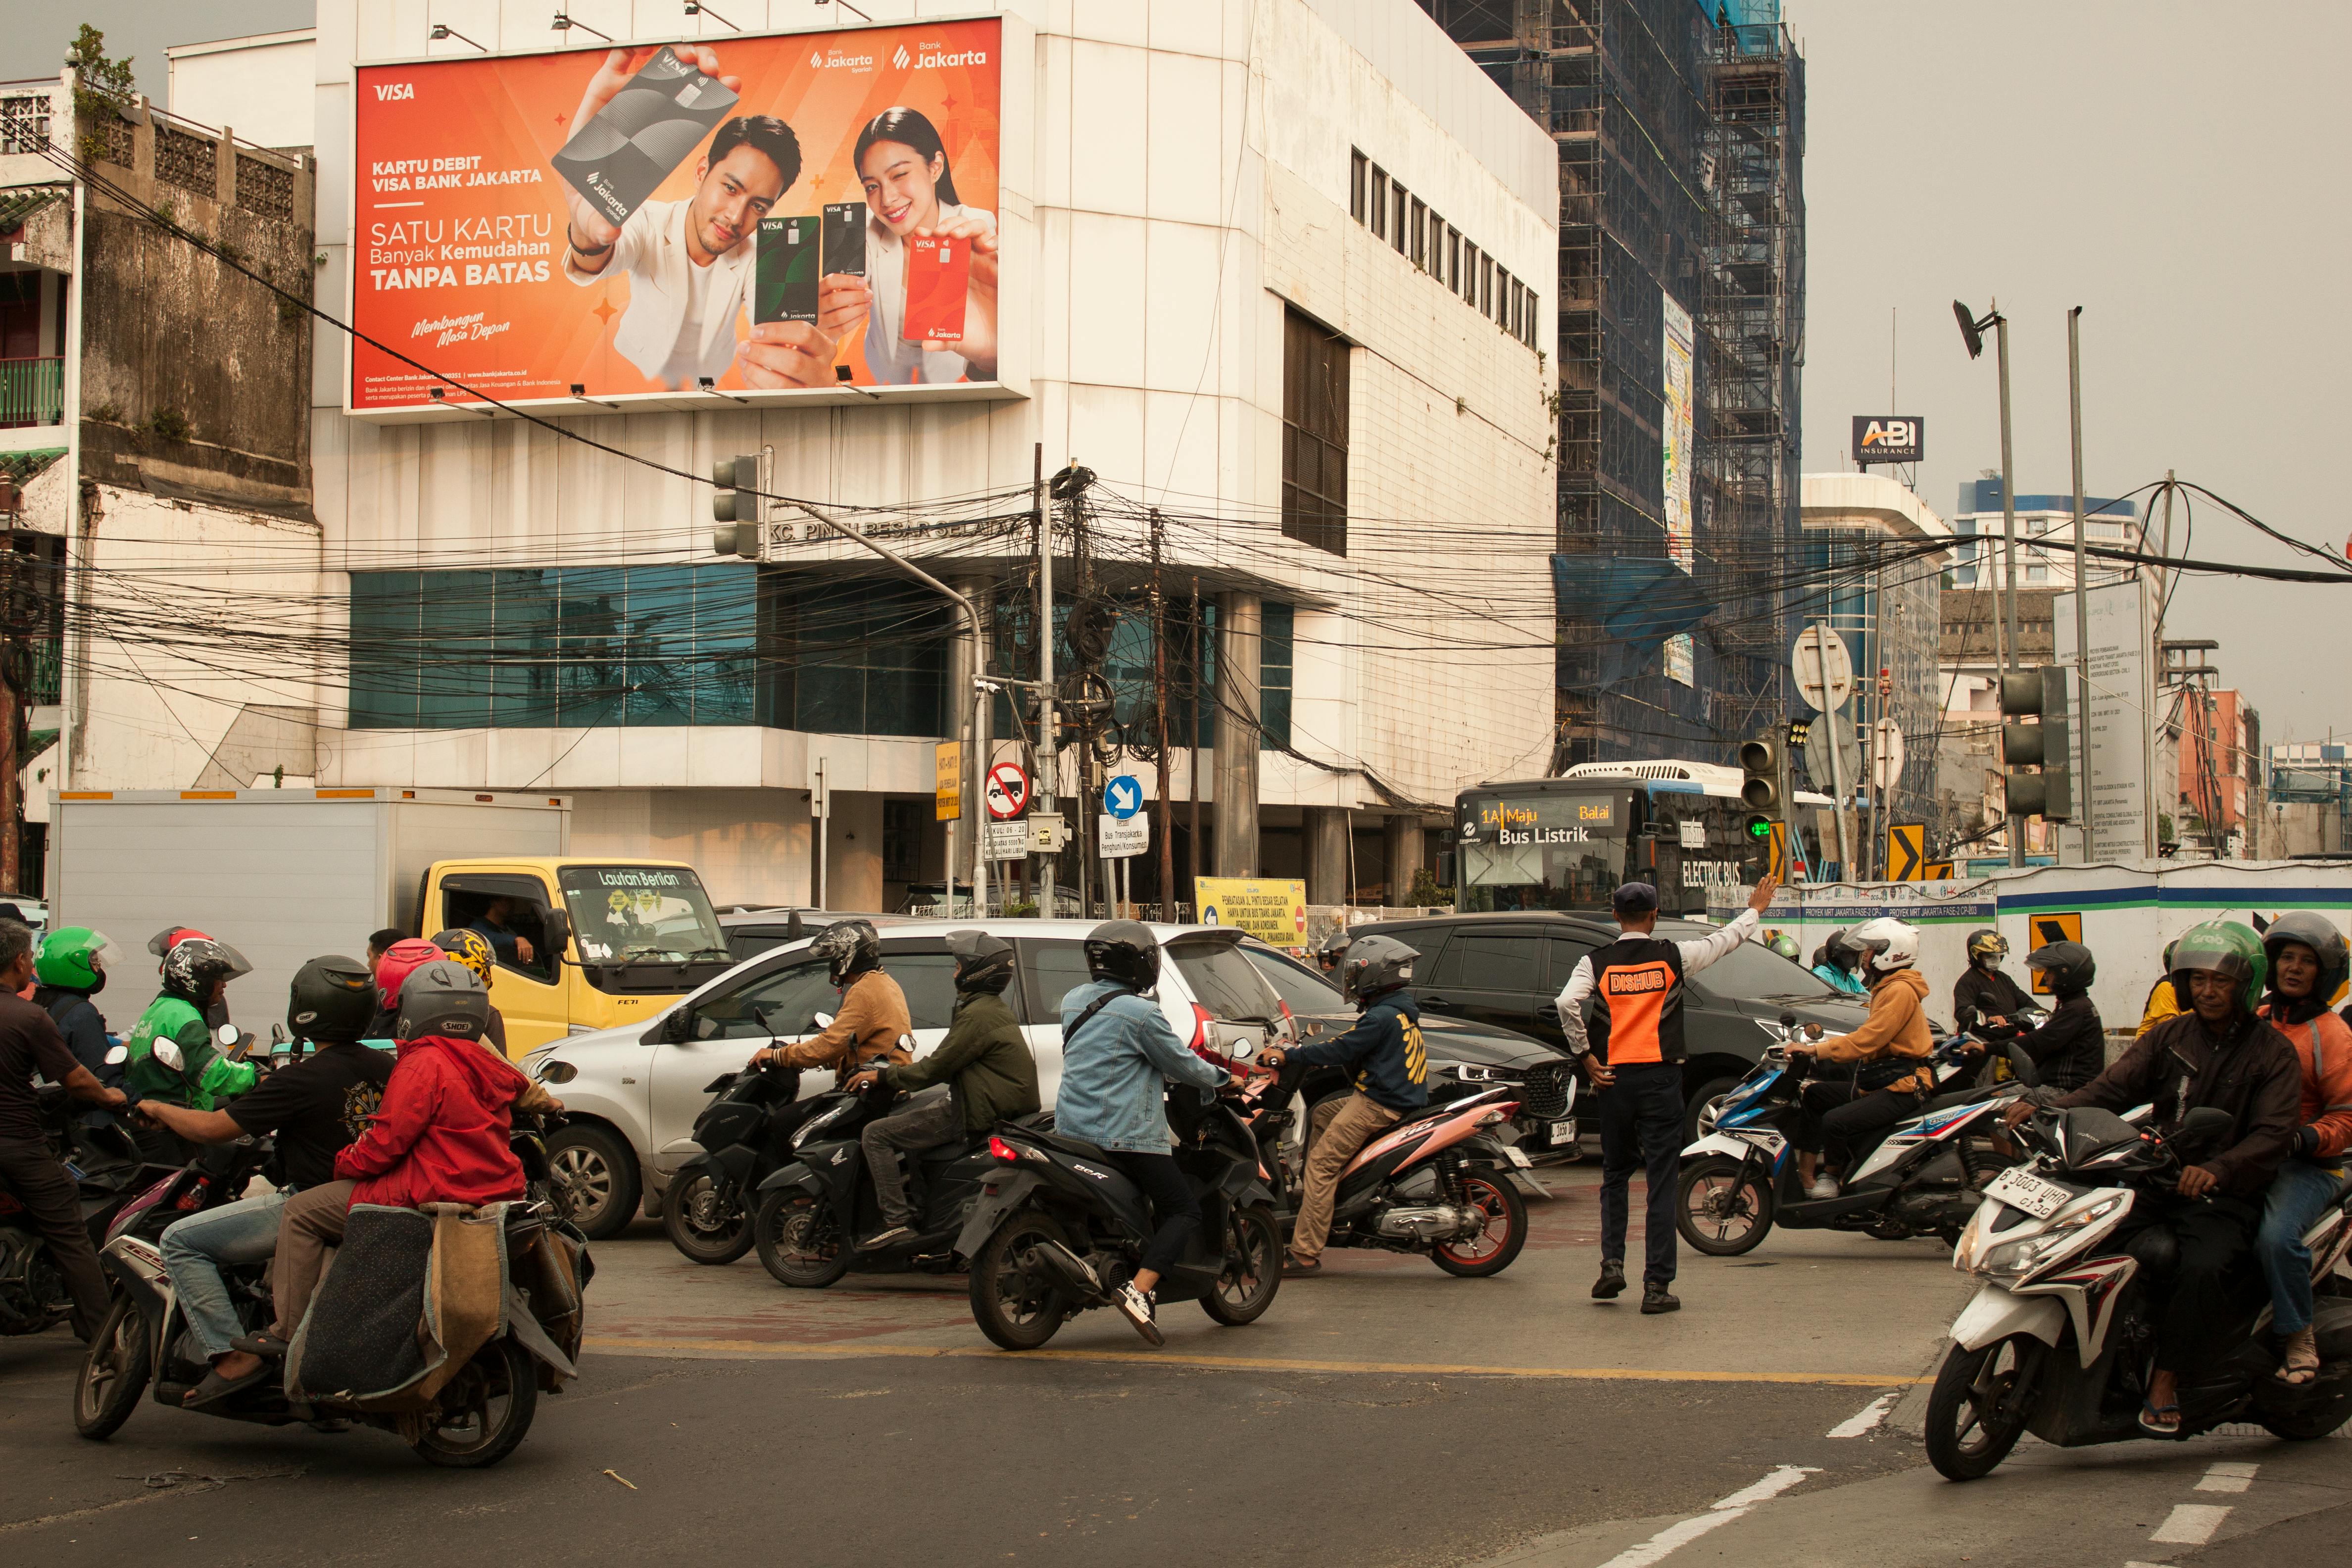
Your team must also distinguish between transit-inflated zones and genuinely affluent residential pockets. A high-speed flyover might boast massive numbers, but those commuters are traveling too fast to absorb your message. When evaluating options, deploy an OOH audience data platform to identify slow-moving choke points where vehicles are stationary. Deploying AI billboard audience analytics guarantees your placements are positioned in areas where the consumer has the cognitive bandwidth to read and remember your brand.
Here is the part that usually surprises people.
Behind the Scenes of a Spatial Buying Decision
Choosing the right OOH placement requires moving past traditional cost-per-square-foot procurement practices. A major fintech brand recently sat in our boardroom, trying to decide between two campaign plans for their new launch. The procurement team favored a proposal filled with low-cost, standard billboards in high-traffic commercial hubs.
However, our spatial reasoning model identified that their tech-professional audience spent most of their commute time stationary along Bengaluru's Outer Ring Road near Marathahalli. By placing the campaign in these high-dwell locations instead of high-speed transit routes, the brand doubled its app downloads despite using fewer boards.
Such results demonstrate why concrete financial and performance data must drive your media buying. Standard metrics like daily vehicle counts often look attractive on a vendor's proposal, but they hide the true cost of invisible impressions. As one media planner put it: "We stopped trusting gut feel the day ADNOXY showed us the data." By comparing formats on a cost-per-effective-impression basis, your team can build a plan that maximizes attention rather than raw physical presence.
The baseline media rates and reach metrics across major Indian corridors reveal these clear structural differences.
| Corridor or Format |
Average Daily Traffic |
Unique Monthly Reach |
Estimated Monthly Cost |
| Western Express Highway Mumbai |
400000 vehicles |
1000000 people |
₹5,00,000 – ₹10,00,000 |
| DND Flyway Delhi |
300000 vehicles |
1050000 people |
₹80,000 – ₹3,50,000 |
| Bandra Worli Sea Link Approach |
400000 vehicles |
900000 people |
₹4,00,000 – ₹8,00,000 |
| Bengaluru Outer Ring Road |
150000 vehicles |
800000 people |
₹70,000 – ₹2,50,000 |
| Standard Metros Static |
100000 vehicles |
500000 people |
₹1,00,000 – ₹5,00,000 |
| Premium Digital Metros |
200000 vehicles |
1200000 people |
₹3,00,000 – ₹15,00,000 |
These price points show why buying blind is a recipe for wasted marketing budgets. With spatial analytics, you can compare the actual attention-value of a gantry in Mumbai against a digital network in Bengaluru to optimize your overall offline ROI.
Conclusion
Brands that refuse to adapt to spatial intelligence will find themselves locked out of modern, data-driven marketing budgets as transparency becomes the industry default. The physical space of Indian cities is growing too complex, and consumer attention too fragmented, to rely on relationship-driven outdoor planning. By shifting your strategy from raw traffic volume to verified attention and sequenced exposures, your business can finally bridge the gap between offline presence and online conversions. The future of out-of-home advertising belongs to those who treat the city as an active, rating-grade behavioral system rather than an unmeasured highway pipe.
Frequently Asked Questions
How does a spatial rating model improve campaign budget allocation compared to legacy methods?
A spatial rating model introduces standard evaluation metrics to verify location performance before capital is deployed. By scoring locations based on dwell time rather than raw traffic volume, you can avoid overpaying for high-speed highway boards that generate minimal visual recall. This allows brands to shift media spend toward highly relevant, slower commuter corridors where the audience is actually stationary.
Why are raw traffic counts misleading for measuring billboard campaign effectiveness?
Raw traffic volumes completely ignore exposure speed and clear sightlines, which directly dictate whether a commuter actually registers an advertisement. A vehicle traveling past a flyover billboard at eighty kilometers per hour has an exposure window of less than two seconds, yielding near-zero brand absorption. Spatial rating engines solve this by measuring the physical speed of traffic to score locations on active dwell time rather than throughput.
What is the benefit of dividing cities into hexagonal behavioral cells for OOH planning?
Dividing a city into hexagonal cells of approximately four hundred and sixty meters allows for precise data aggregation without relying on arbitrary political boundaries or static PIN codes. Each hex cell acts as an independent behavioral unit where movement data, local points of interest, and regional affluence metrics are consolidated. This creates a highly standardized scoring logic that can compare locations across different cities like Mumbai and Bengaluru.
How does corridor intelligence generate cumulative memory effects for offline advertising?
Corridor intelligence treats roads as connected behavioral systems rather than pipes for traffic, allowing brands to sequence their placements along a commuter's daily route. By encountering the same brand multiple times across a specific corridor, the commuter experiences a forced-repetition effect that builds strong visual recall. This systematic sequencing produces far higher brand lift than placing single, isolated boards across disconnected neighborhoods.
What is the role of brand archetypes in spatial media planning?
Brand archetypes allow the spatial engine to apply different mathematical weights to the same city data based on a campaign's specific objectives. For instance, a luxury brand archetype prioritizes high-street and corporate corridors, while an FMCG brand archetype targets high-traffic transit hubs. This guarantees that your media plan is custom-tailored to your specific target audience's daily movement behavior.