Delhi NCR
Planning Audit.
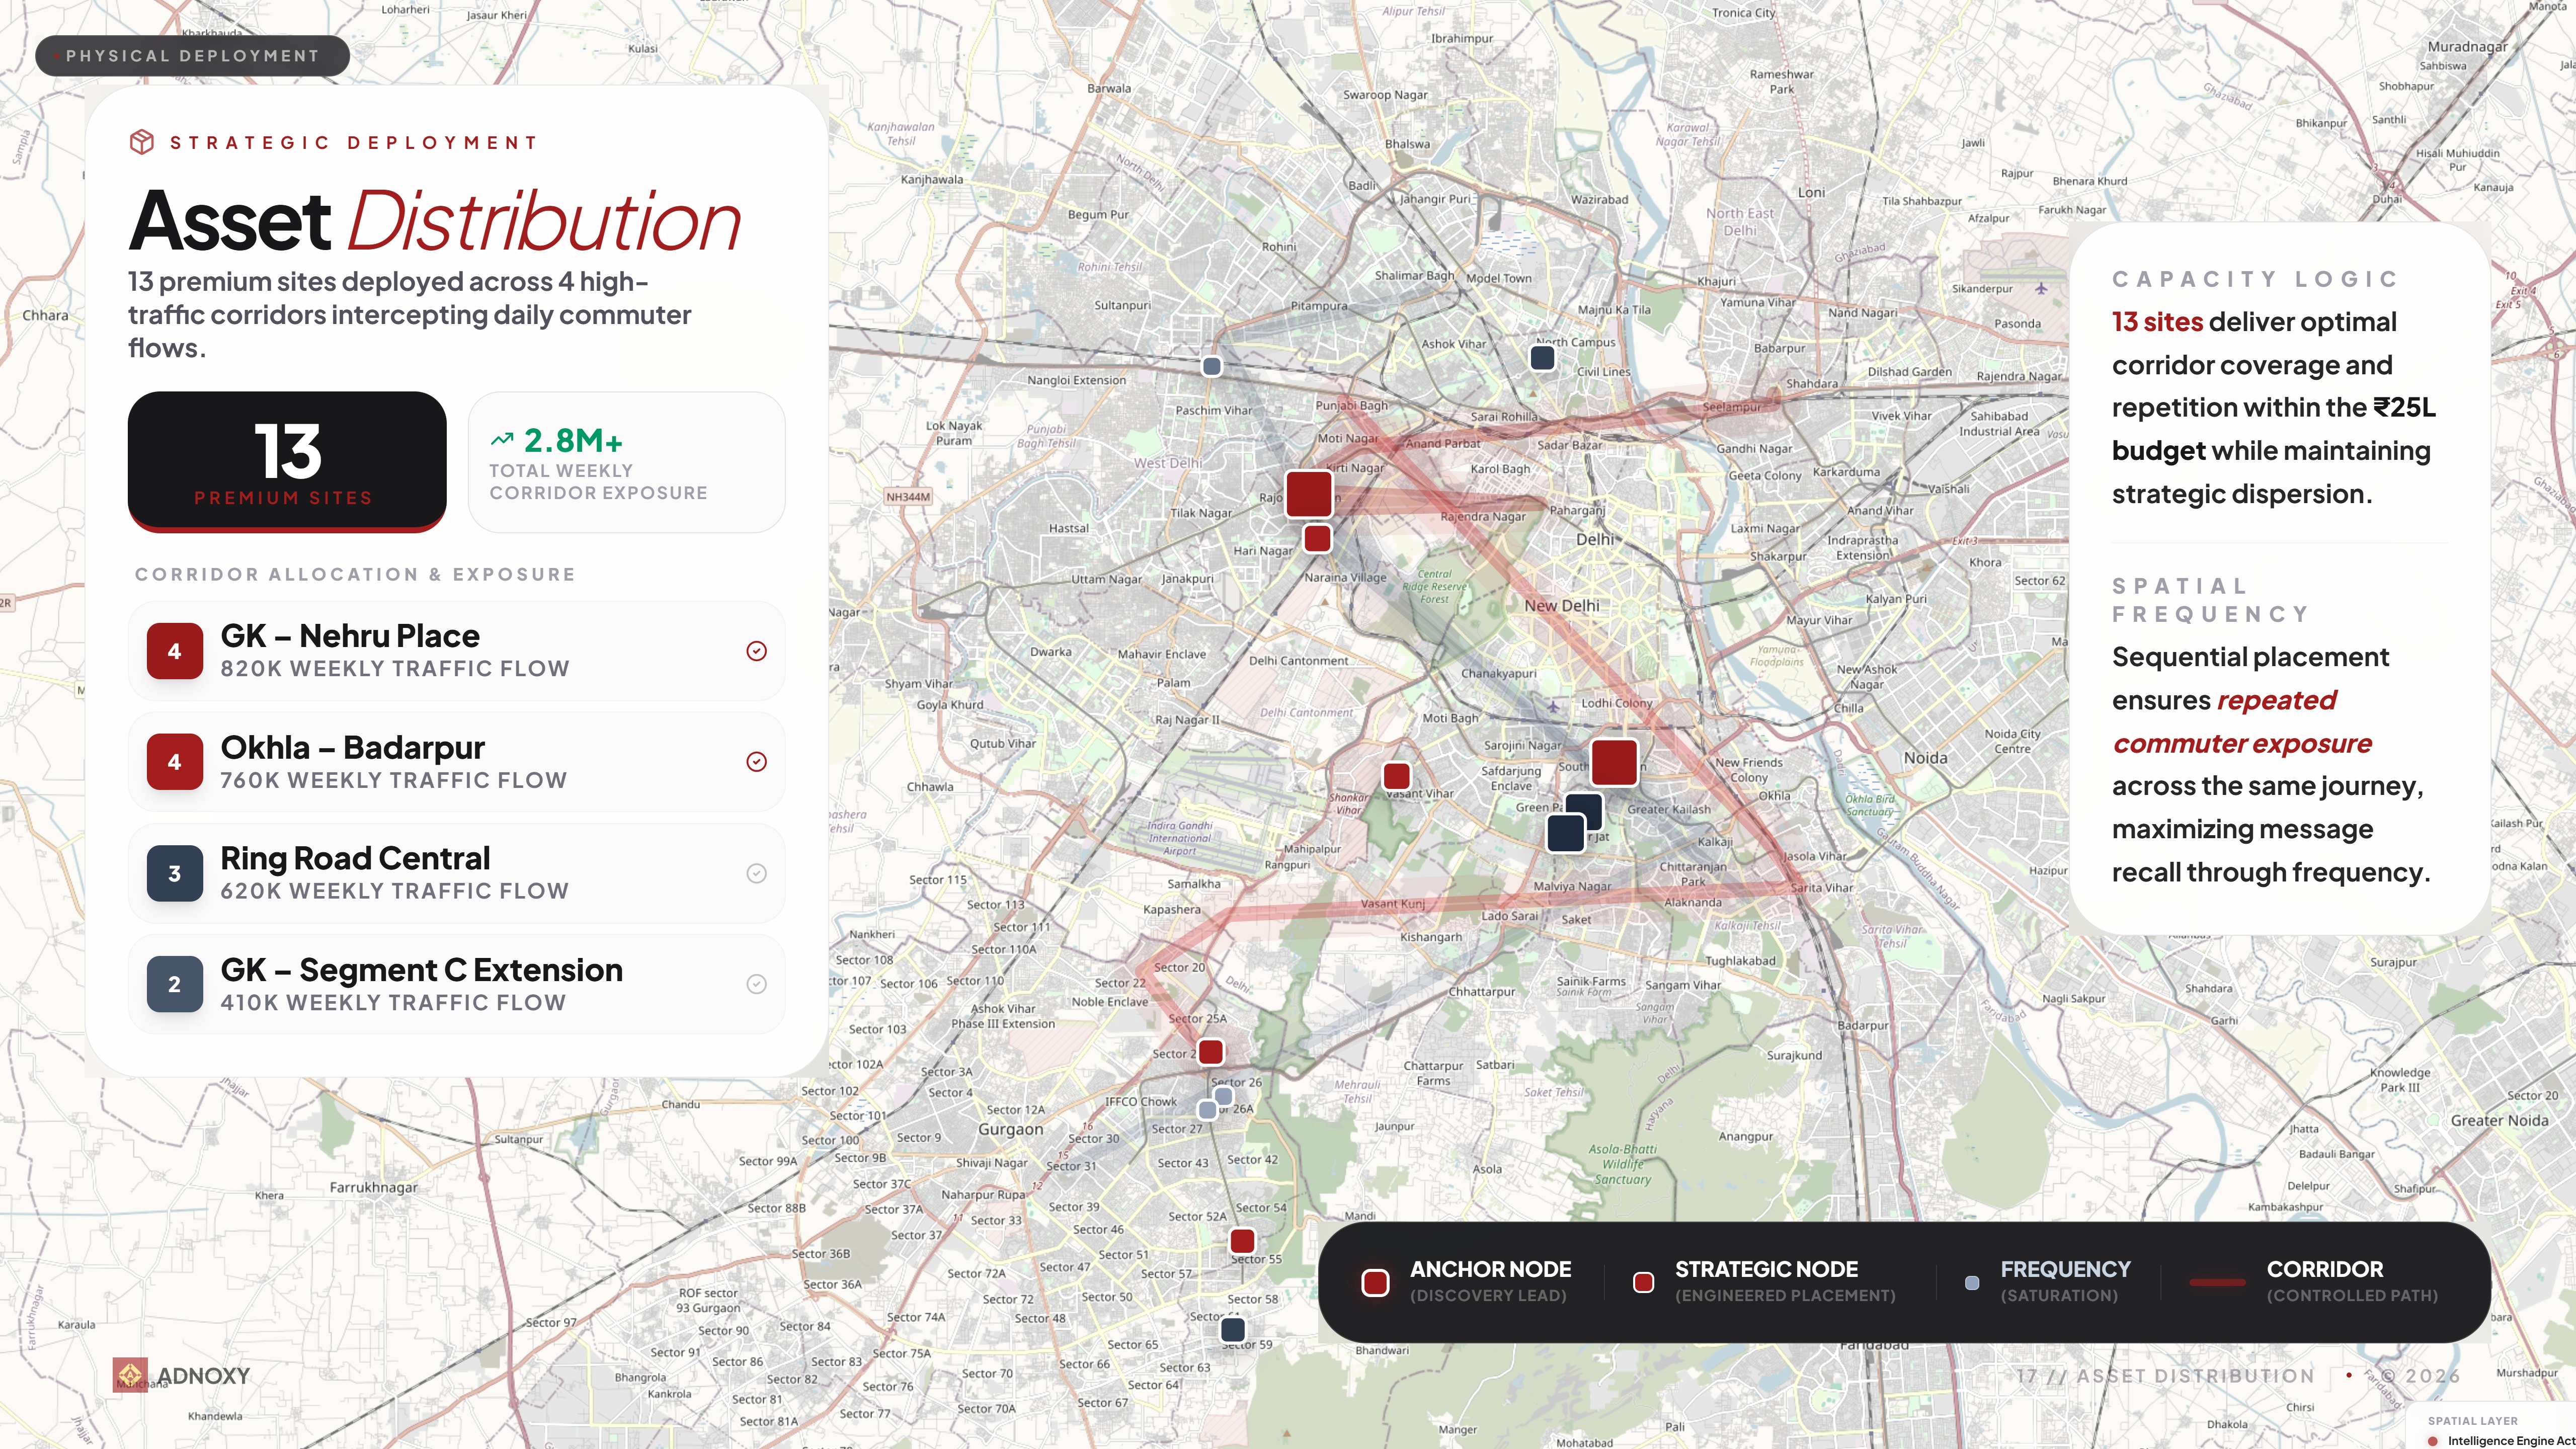
A residential real estate developer approached Adnoxy to evaluate how a ₹25L OOH budget should be deployed across Delhi NCR.
The objective was not maximum city-wide reach. It was repeated exposure across the commuter corridors most structurally aligned with luxury residential demand.
What follows is the planning logic, movement analysis, and corridor evaluation framework used to build the final deployment strategy.
This is the plan we produced. Not a summary. The reasoning, in sequence.
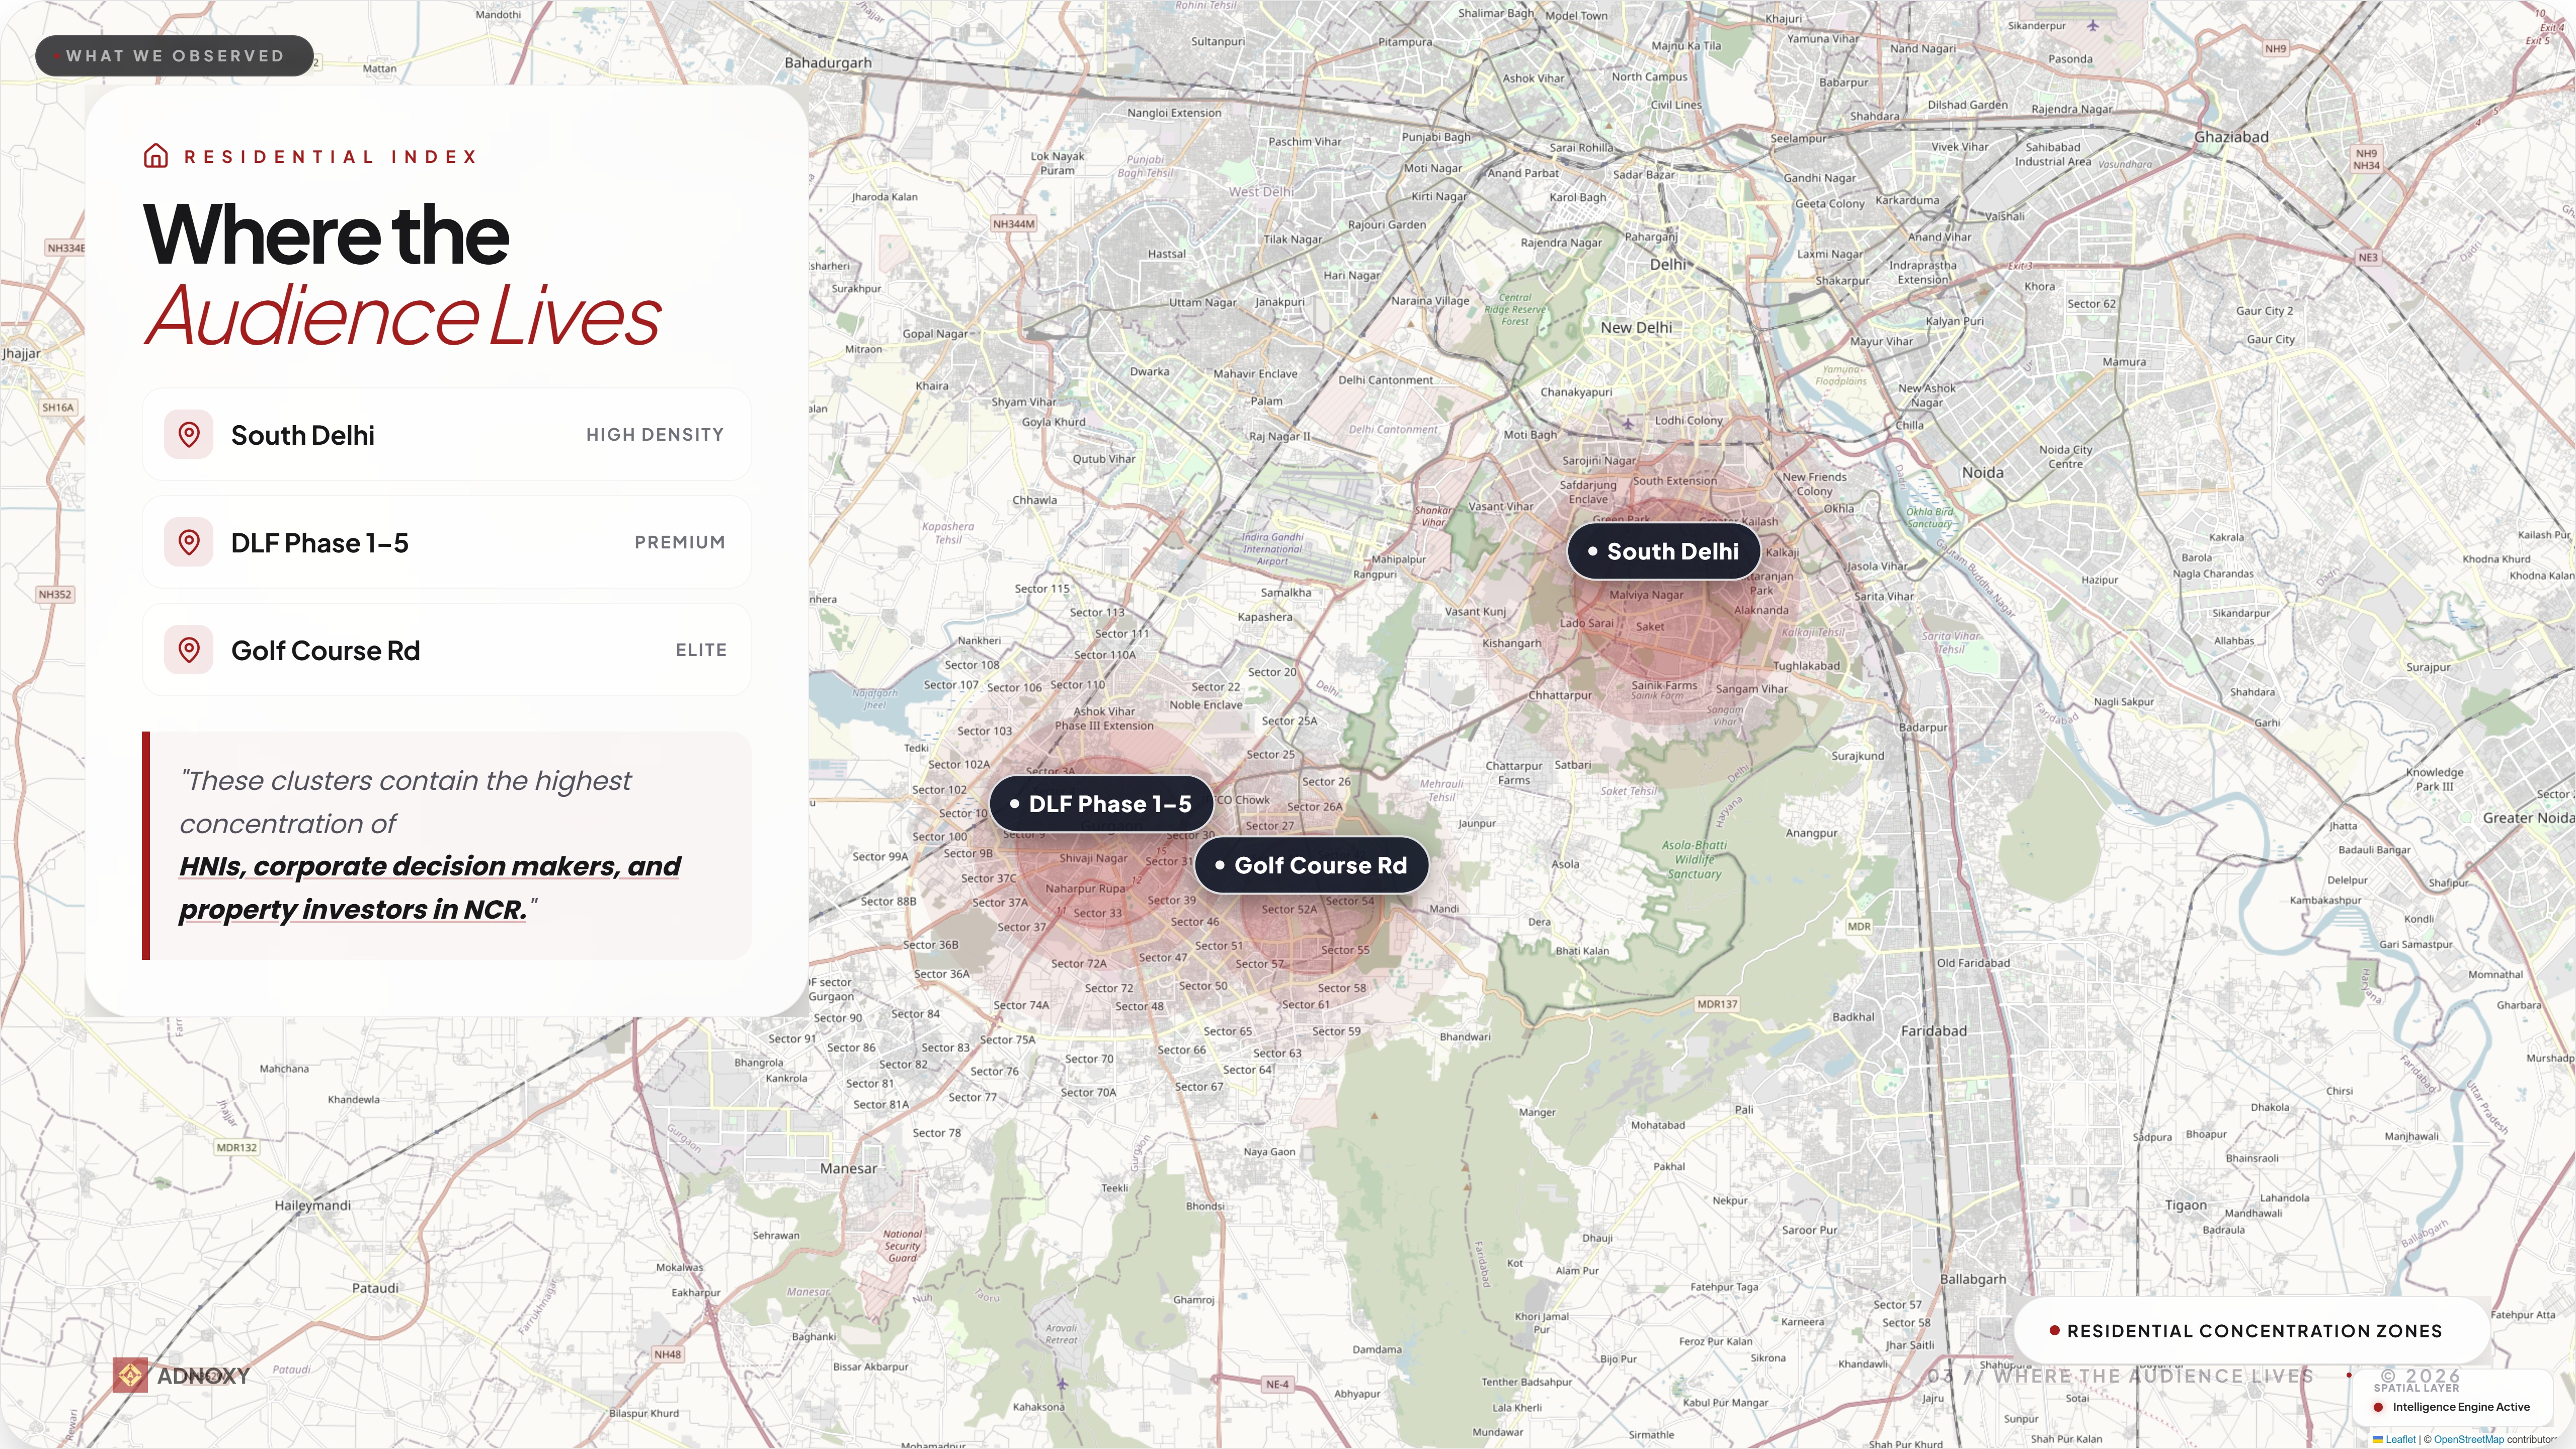
Fig. 00 — Delhi NCR region. Residential hubs and primary commuter corridors.
Before a single site was evaluated, the mapping model plotted target audience residential coordinates.
South Delhi. DLF Phase 1-5. Golf Course Road. Nirvana Country.
Corporate professionals. Entrepreneurs. HNIs. Property investors. Ages 30+. Household income 5-10L+.
These aren't demographic categories. They are spatial coordinates. Residential density was modeled before inventory evaluation began.
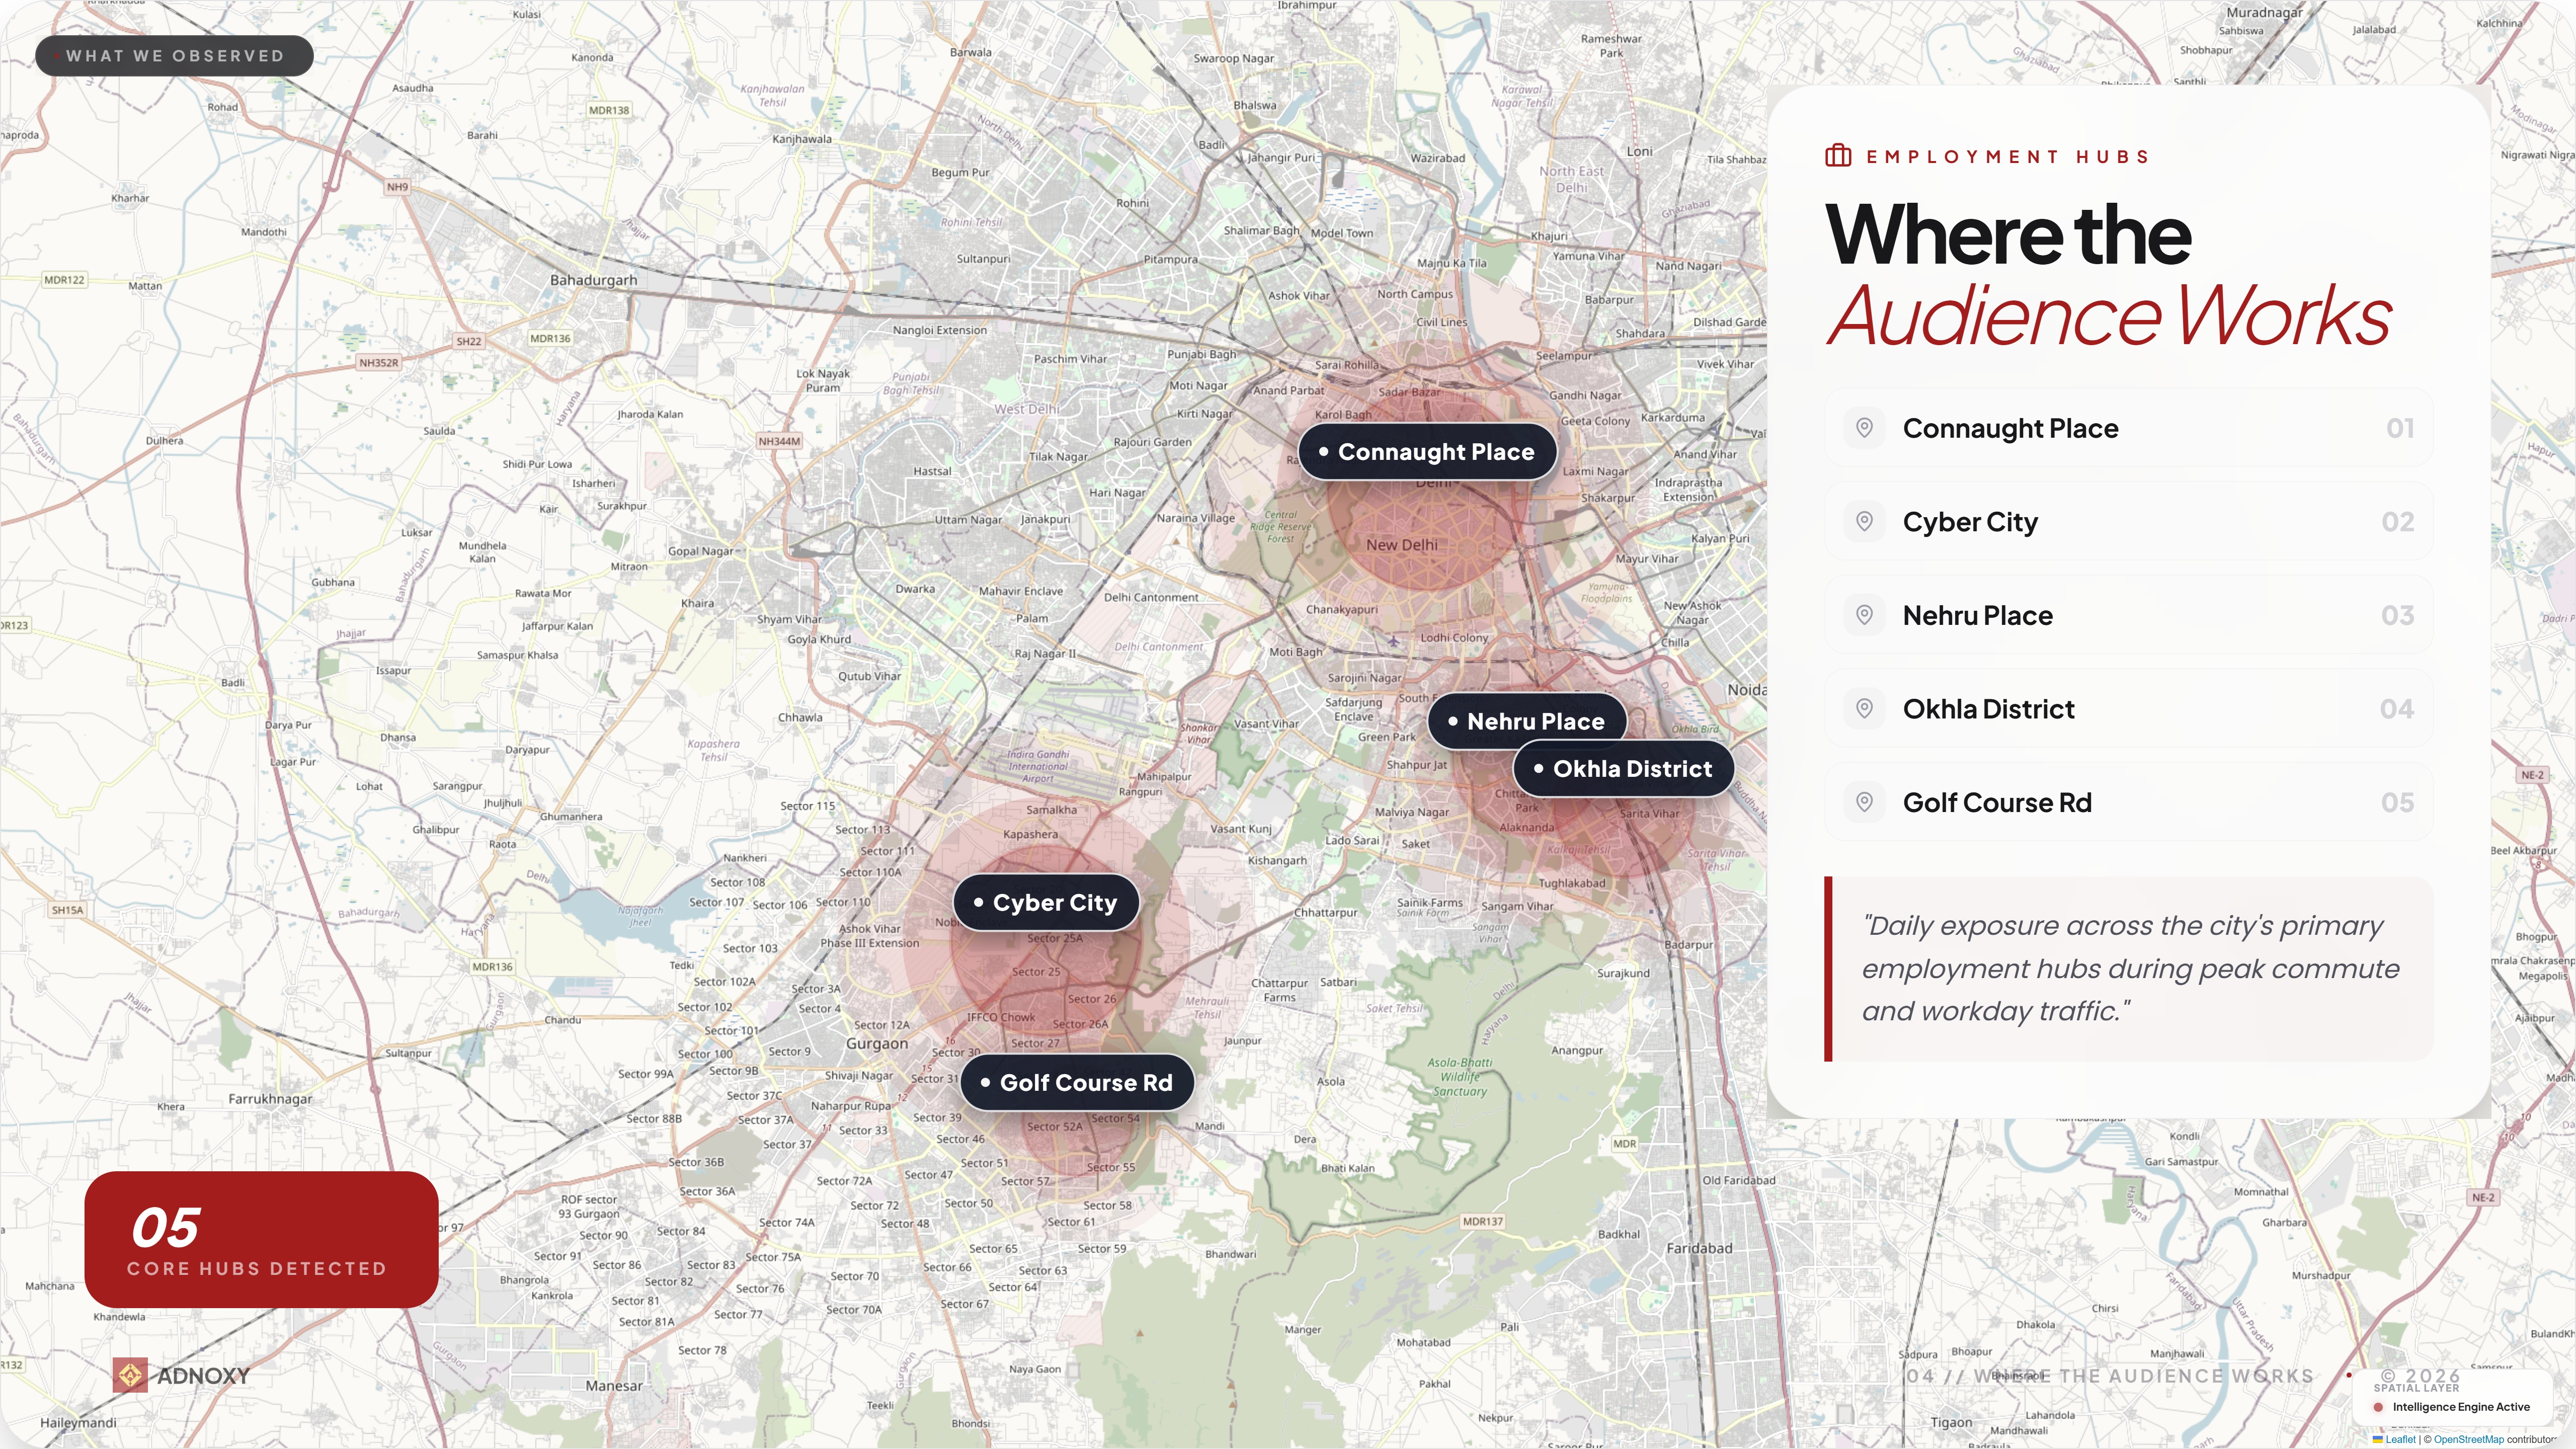
The same audience disperses daily.
Clustered at home.
Fragmented at work.
Buying traffic on central arteries produces massive audience spillover because the audience doesn't concentrate at a single employment hub — it radiates outward across five distinct zones.
Standard deployment logic fails under this dispersion pattern.
Home to work. Work to home. Every day. The same routes. The same sequence.
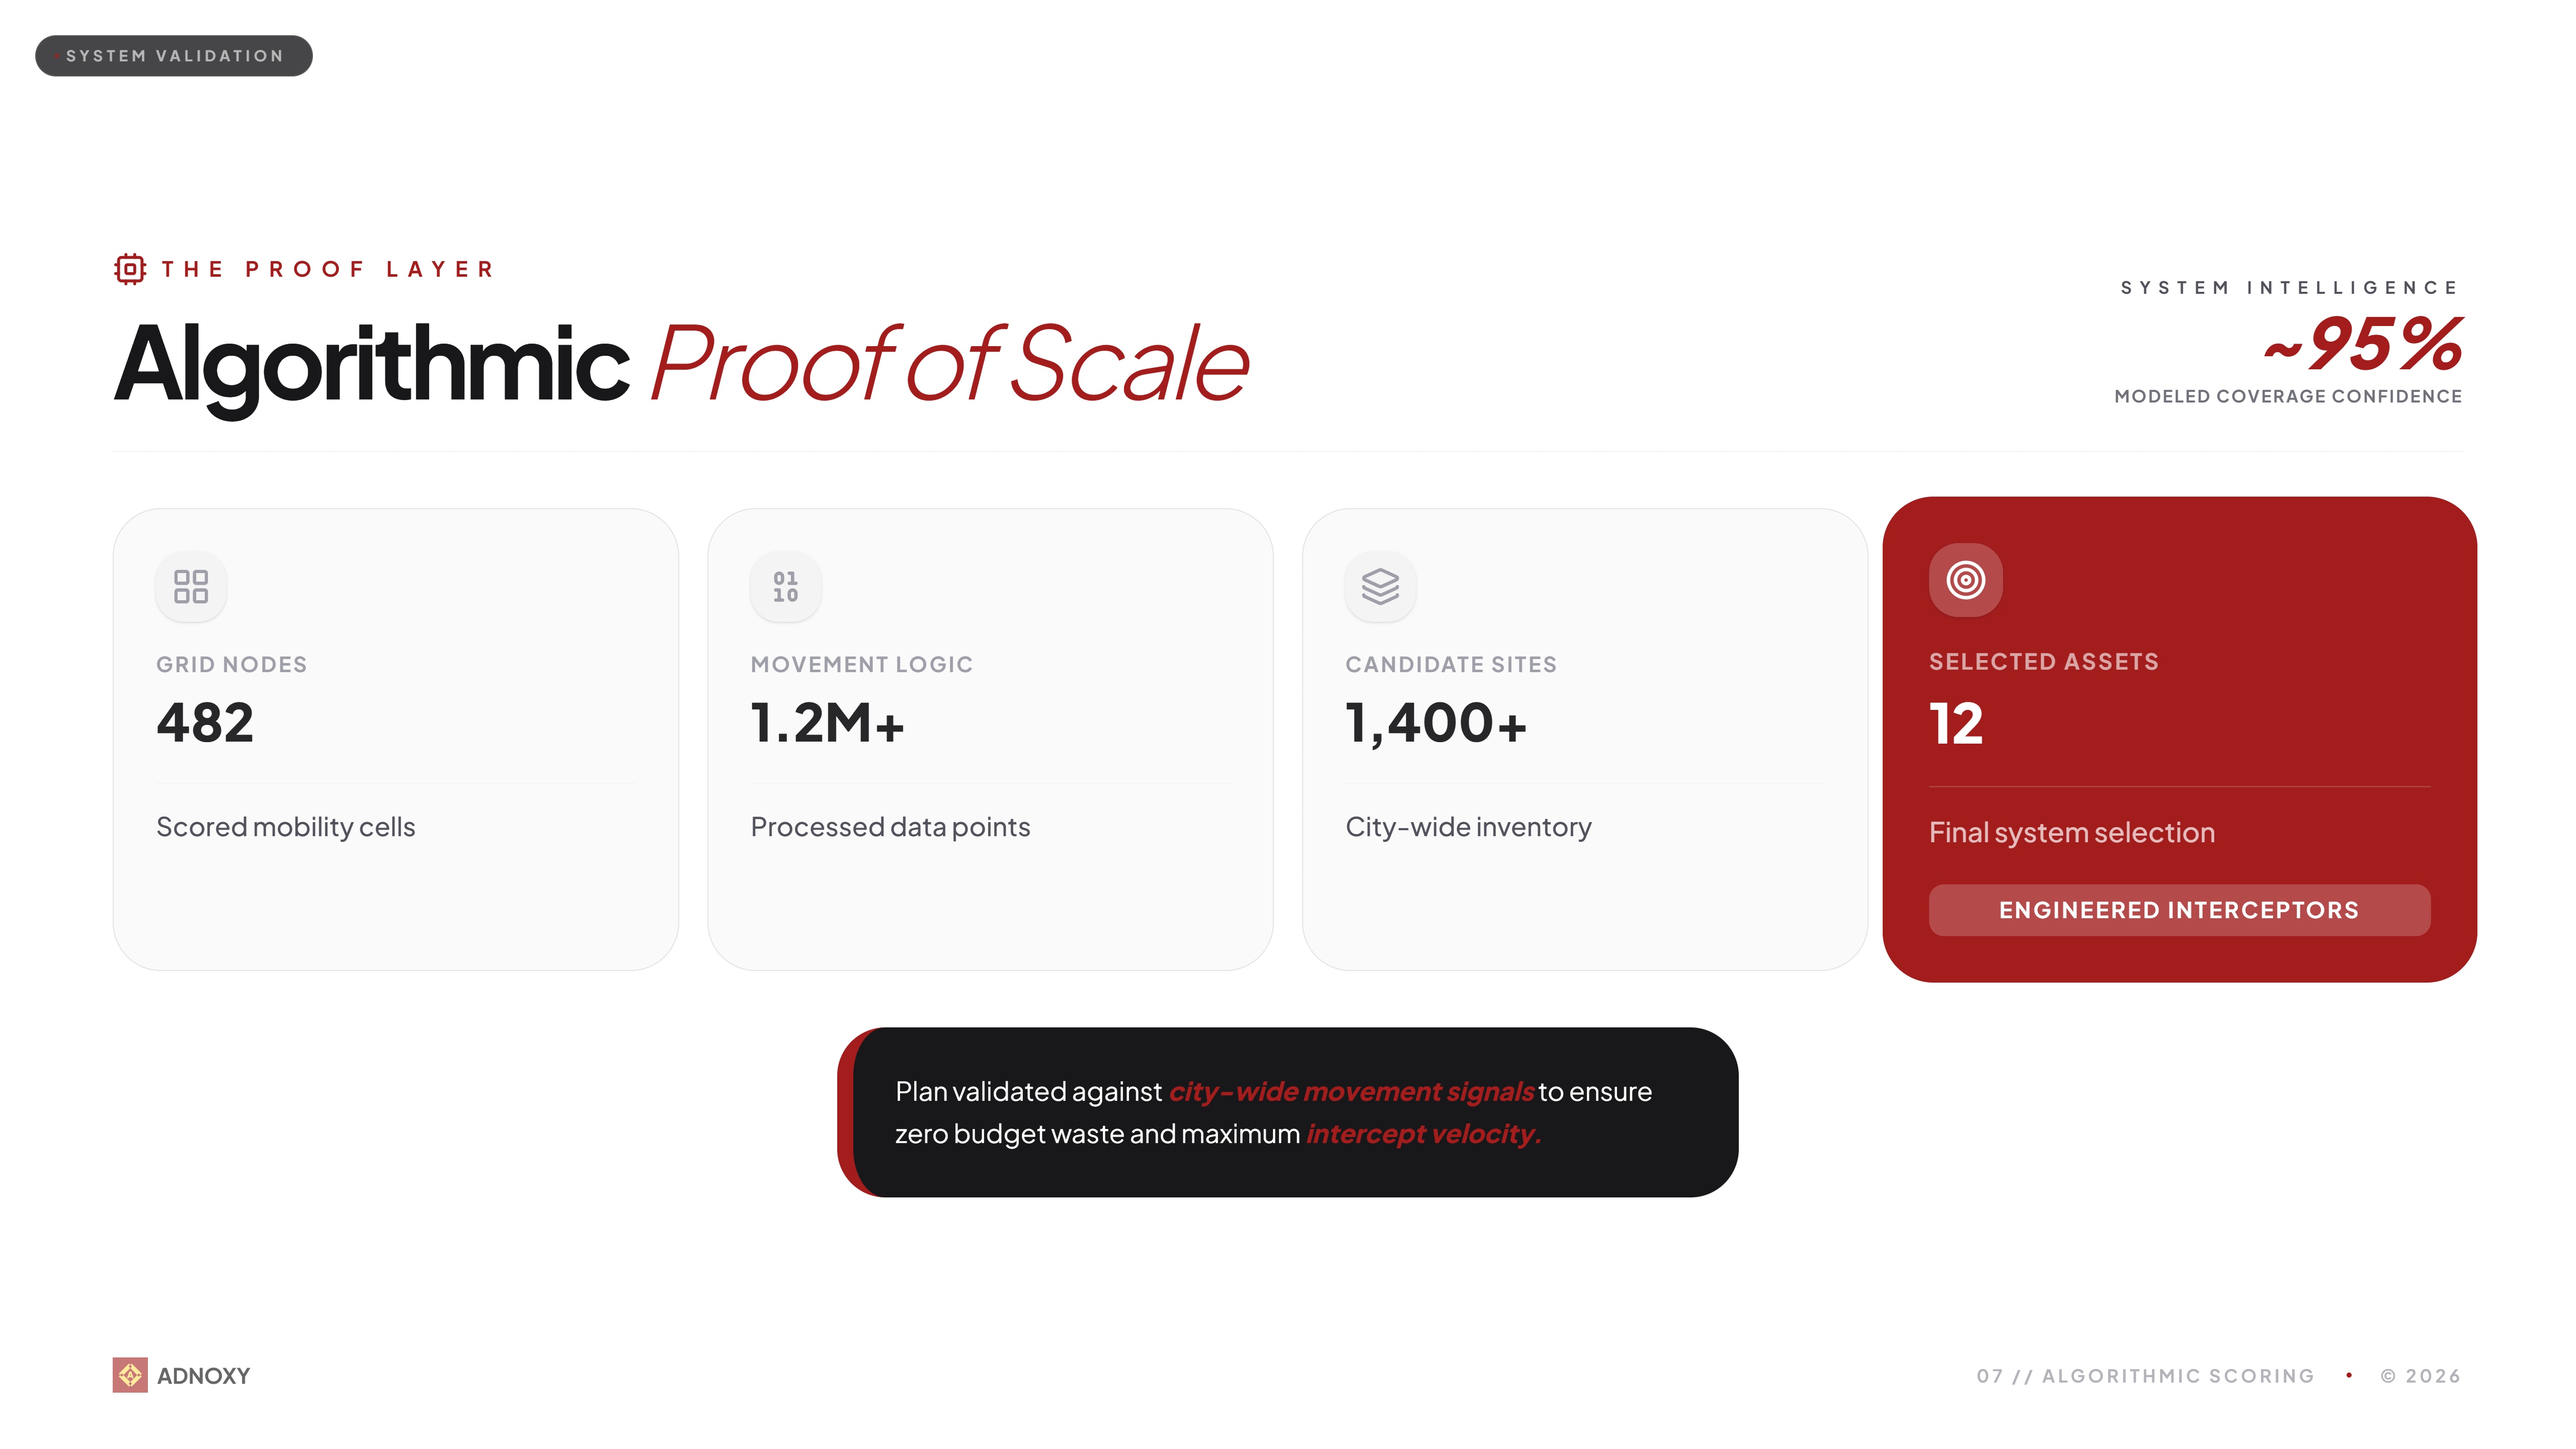
200 spatial cells evaluated across the NCR movement grid.
50 cells selected after demand scoring.
37 sq km of confirmed high-intensity elite commuter movement.
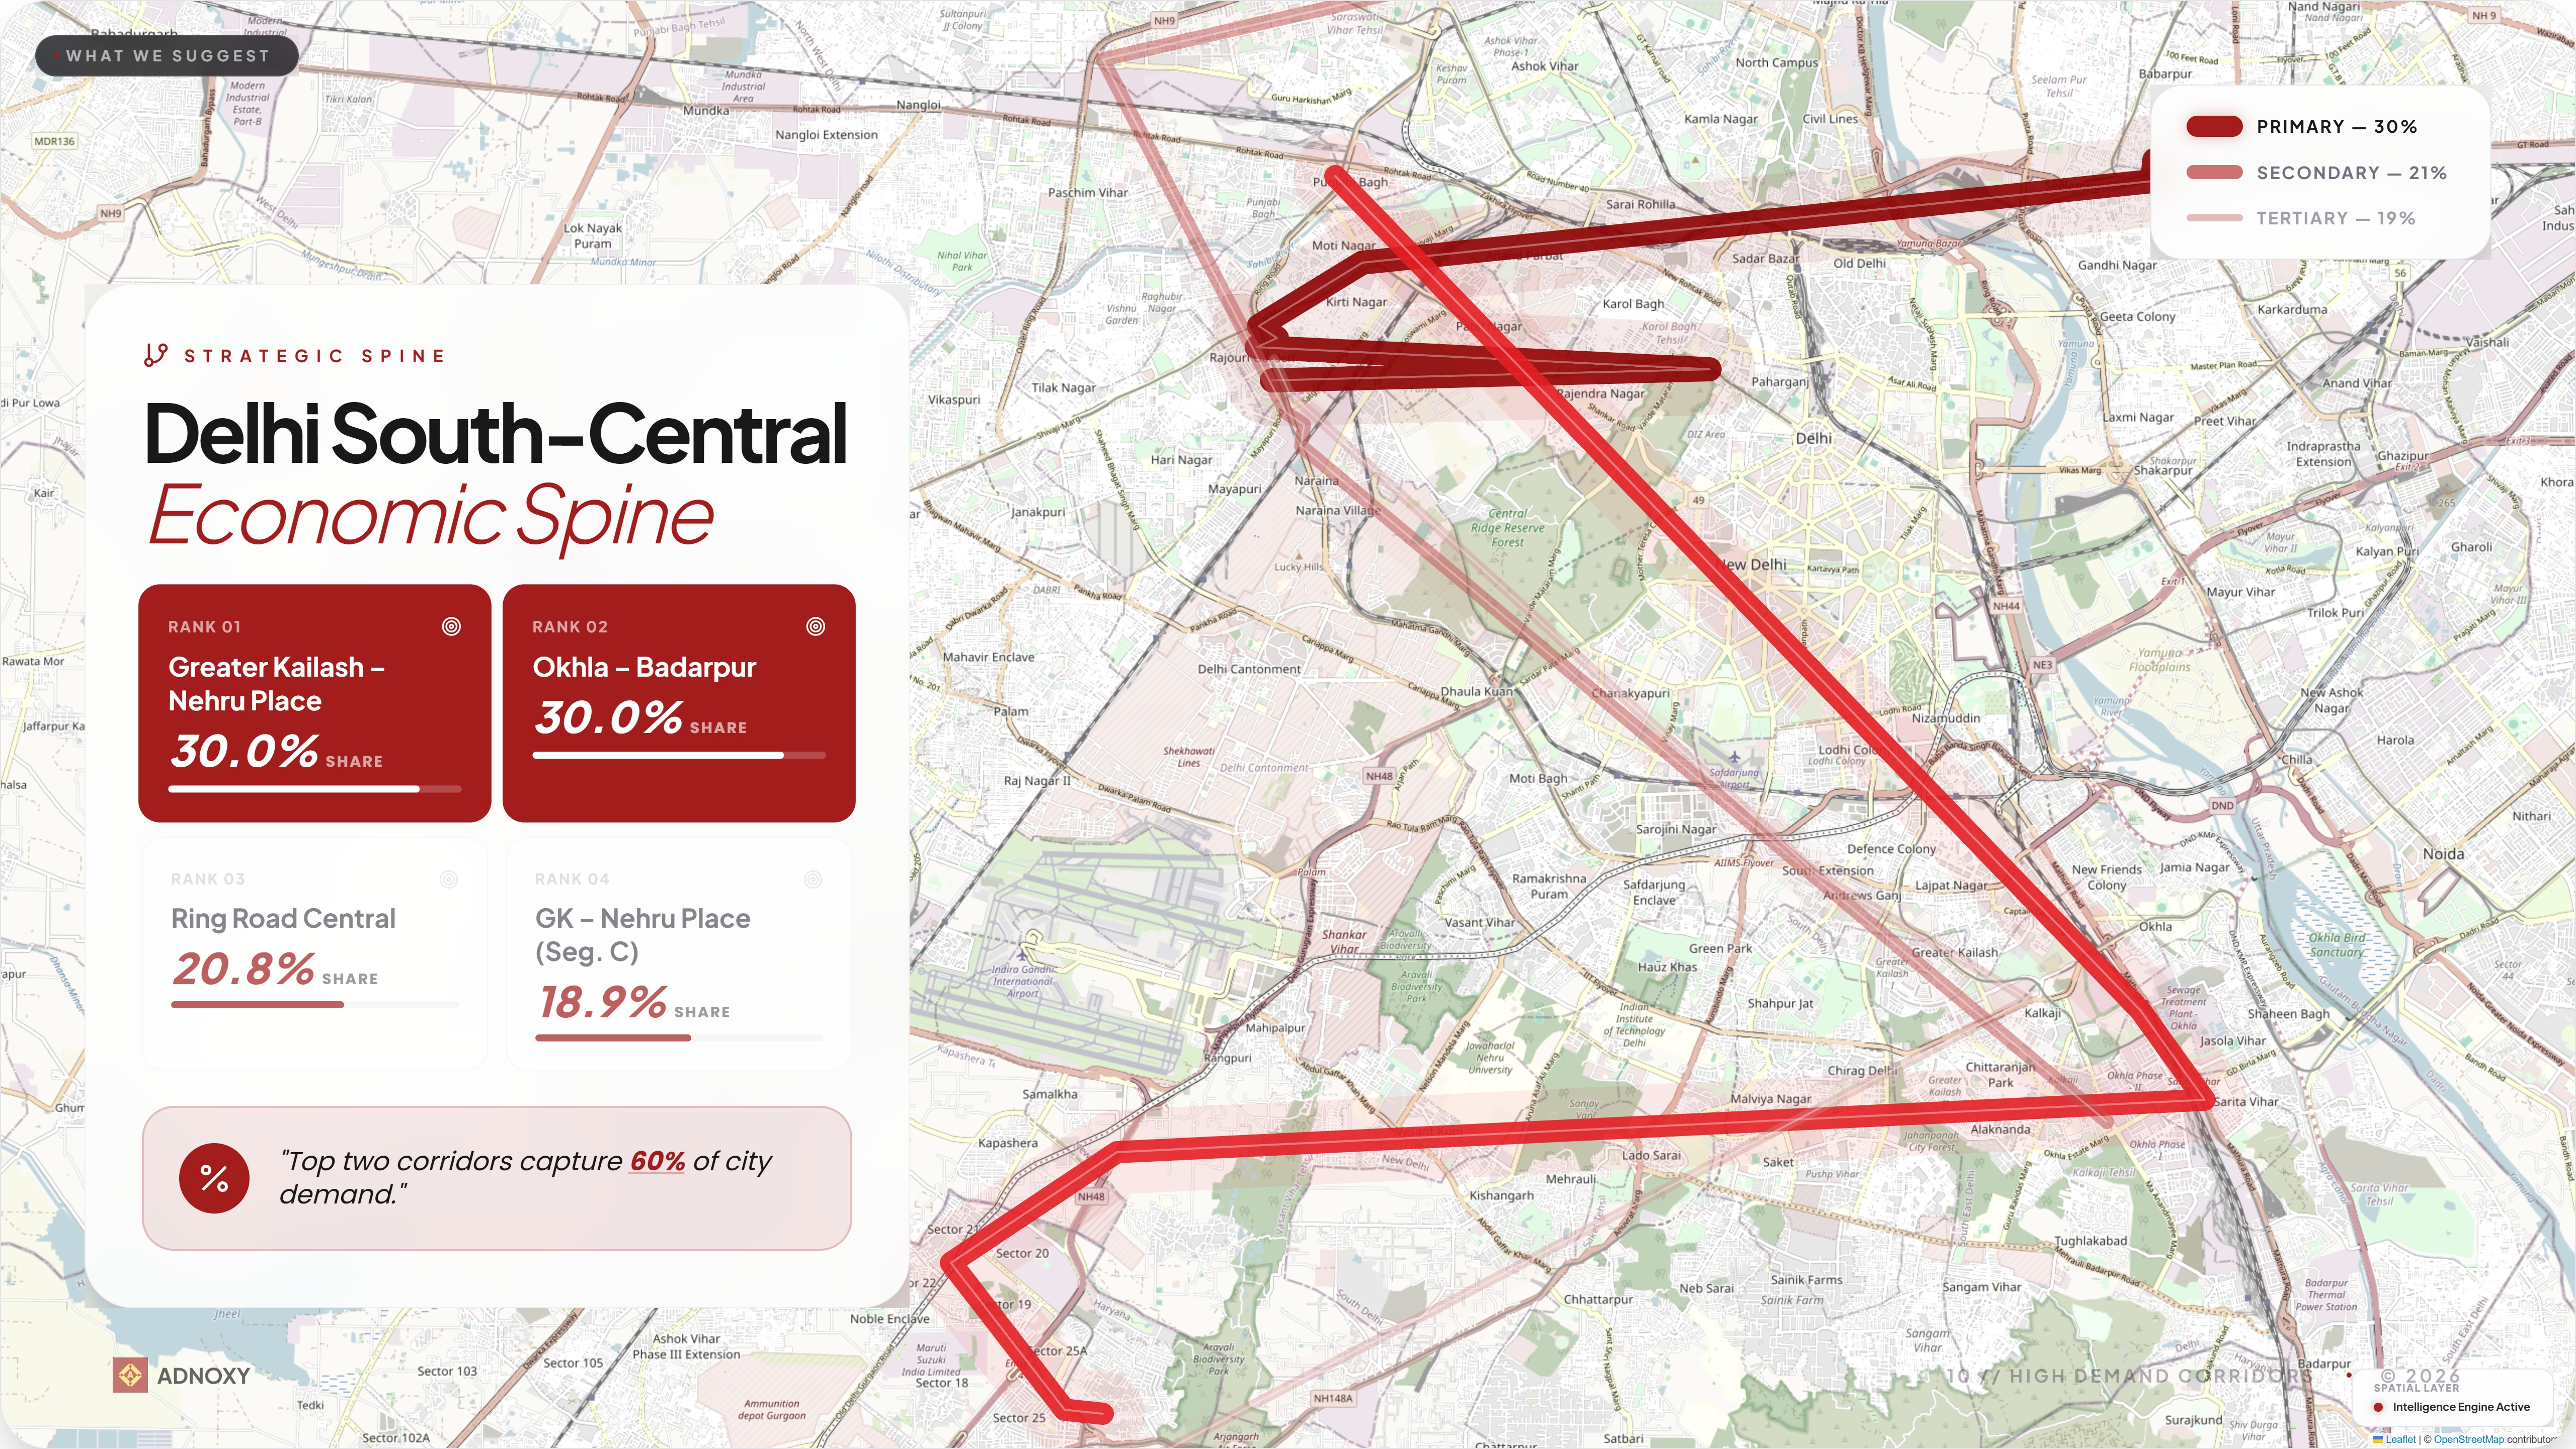
Two corridors dominate:
The rest of the city distributes the remaining 40%.
This means the campaign does not need to be everywhere. It needs to be precise at two corridors and present across two more. Additional corridor expansion showed weak incremental value relative to spend.
The difference between a media plan and a route planning audit is quantified in these constraints.
Most agency plans start with 20 sites and negotiate down to 13. This process started with 1.2 million data points and filtered to 13 locations. The selection is not inventory-driven. It is demand-driven.
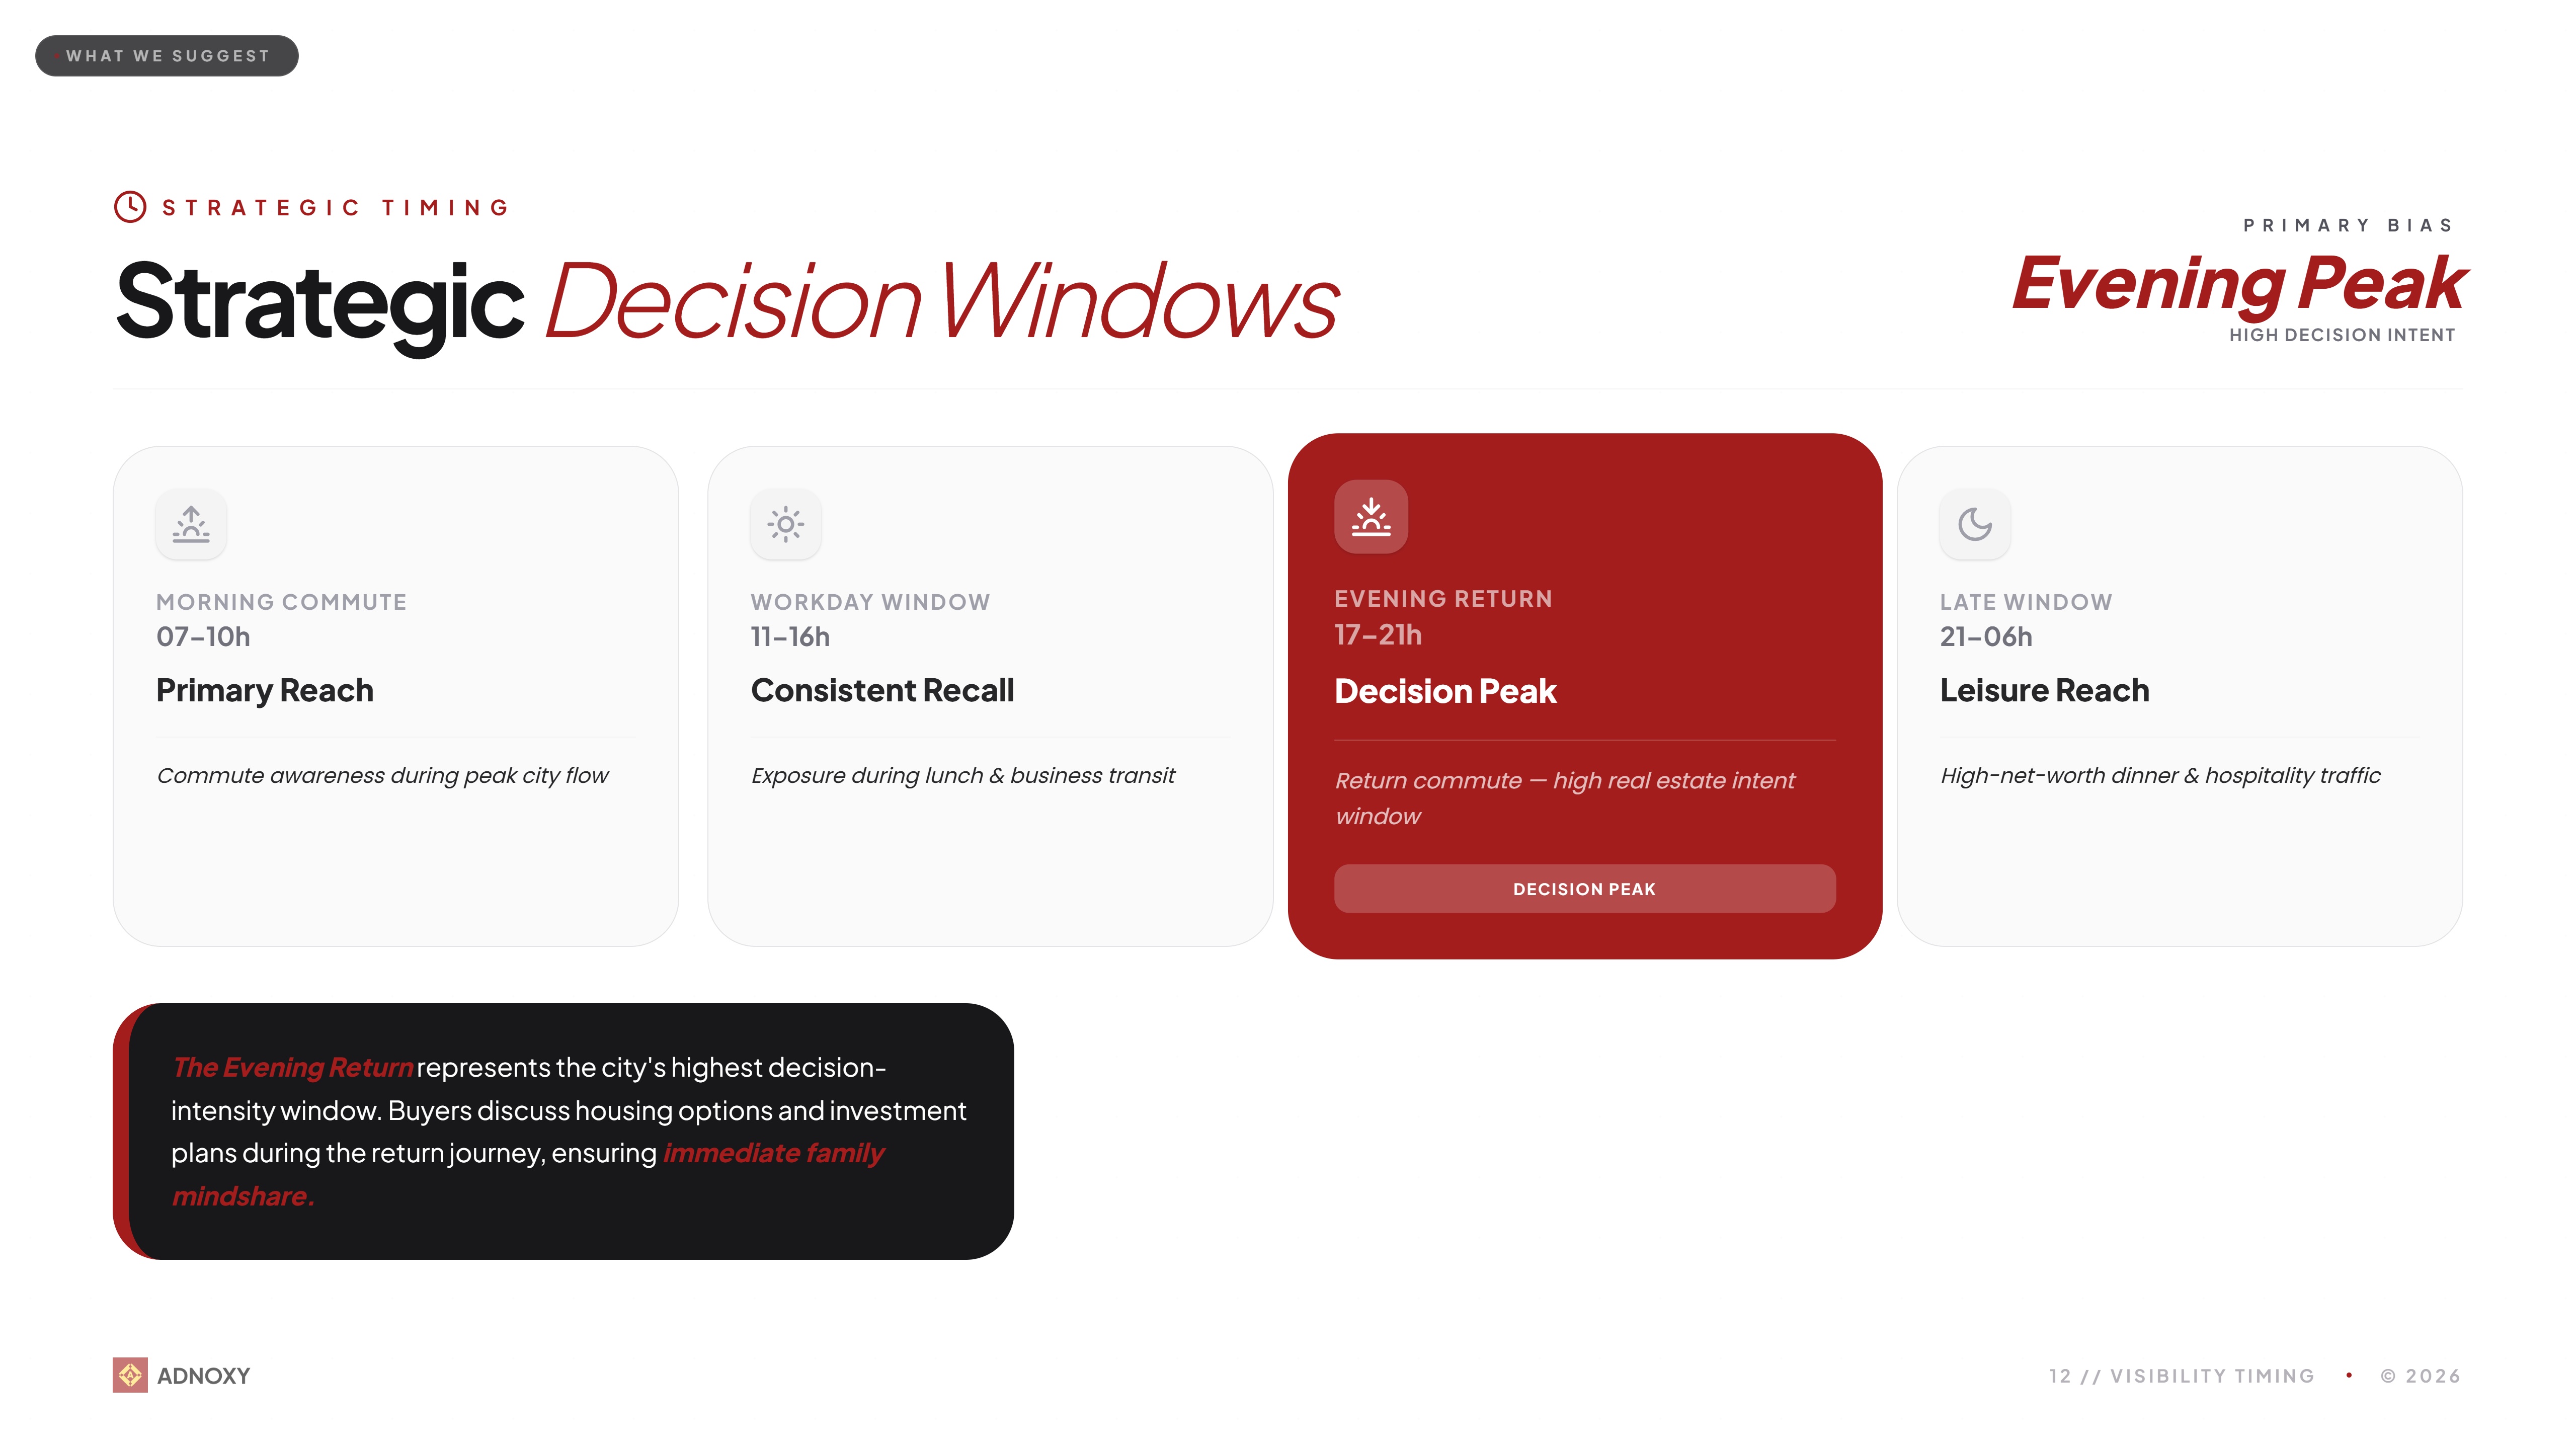
Traffic data tells you when people move. It does not tell you when people decide.
The Evening Return — 17:00 to 21:00 — was modeled as the critical decision window for high-end residential purchase.
Evening return windows aligned more consistently with high-intent residential consideration behavior. Return-hour exposure showed stronger downstream decision correlation than morning transit exposure.
Placements were selected to align with intent latency rather than peak transit velocity.
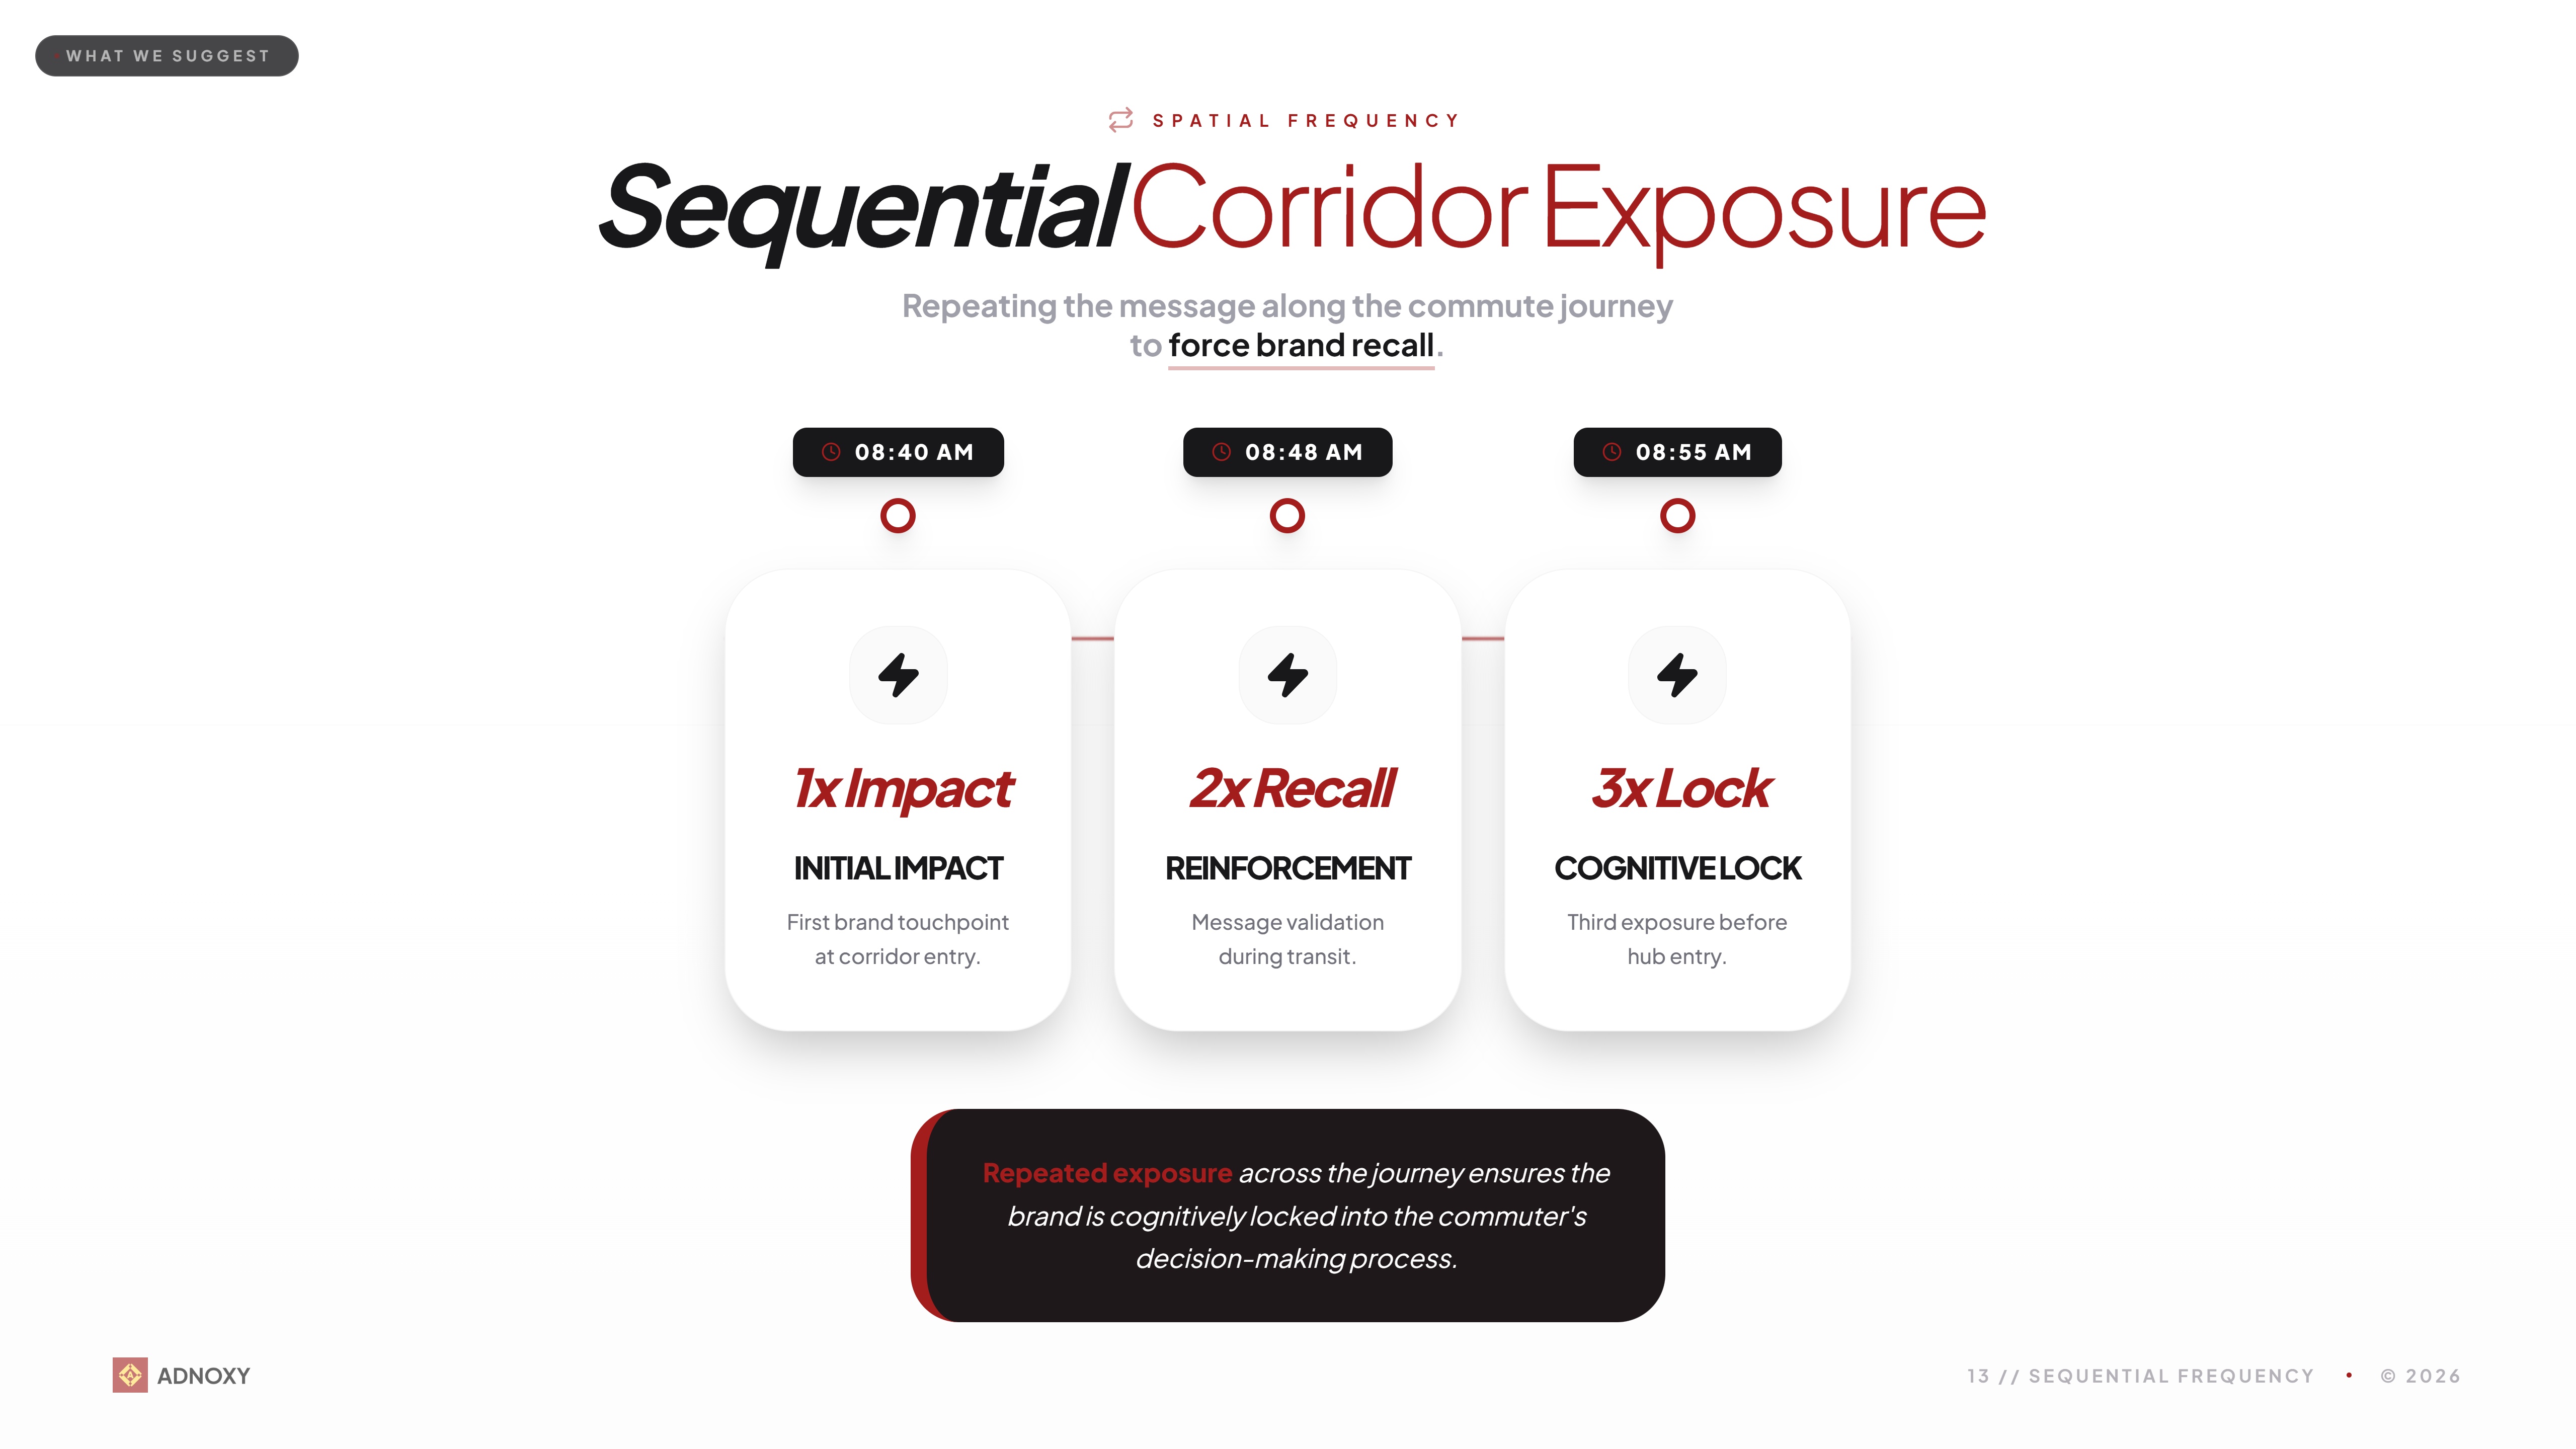
A single impression produces visibility. Three sequential impressions produce memory.
The plan was designed around a specific exposure sequence.
Repetition was localized to a single confirmed movement corridor. The spatial layout ensures a minimum three-exposure frequency for the target transit segment.
Ring Road West Cluster
- [-]High traffic volume
- [-]Weak commuter persistence
- [-]Poor affluent density alignment
- [-]Low sequential reinforcement potential
It was rejected here because high traffic does not equal the right traffic. The audience profile on Ring Road West does not match high-income residential buyers at the required income threshold. Inventory availability is not a selection criterion.
Transit Flyover Group
- [-]High speed exposure
- [-]Minimal dwell time
- [-]Poor recall retention
- [-]Weak route continuity
At flyover speeds, visual processing time drops below the threshold required for brand encoding. Exposure quality degraded rapidly due to limited dwell continuity.
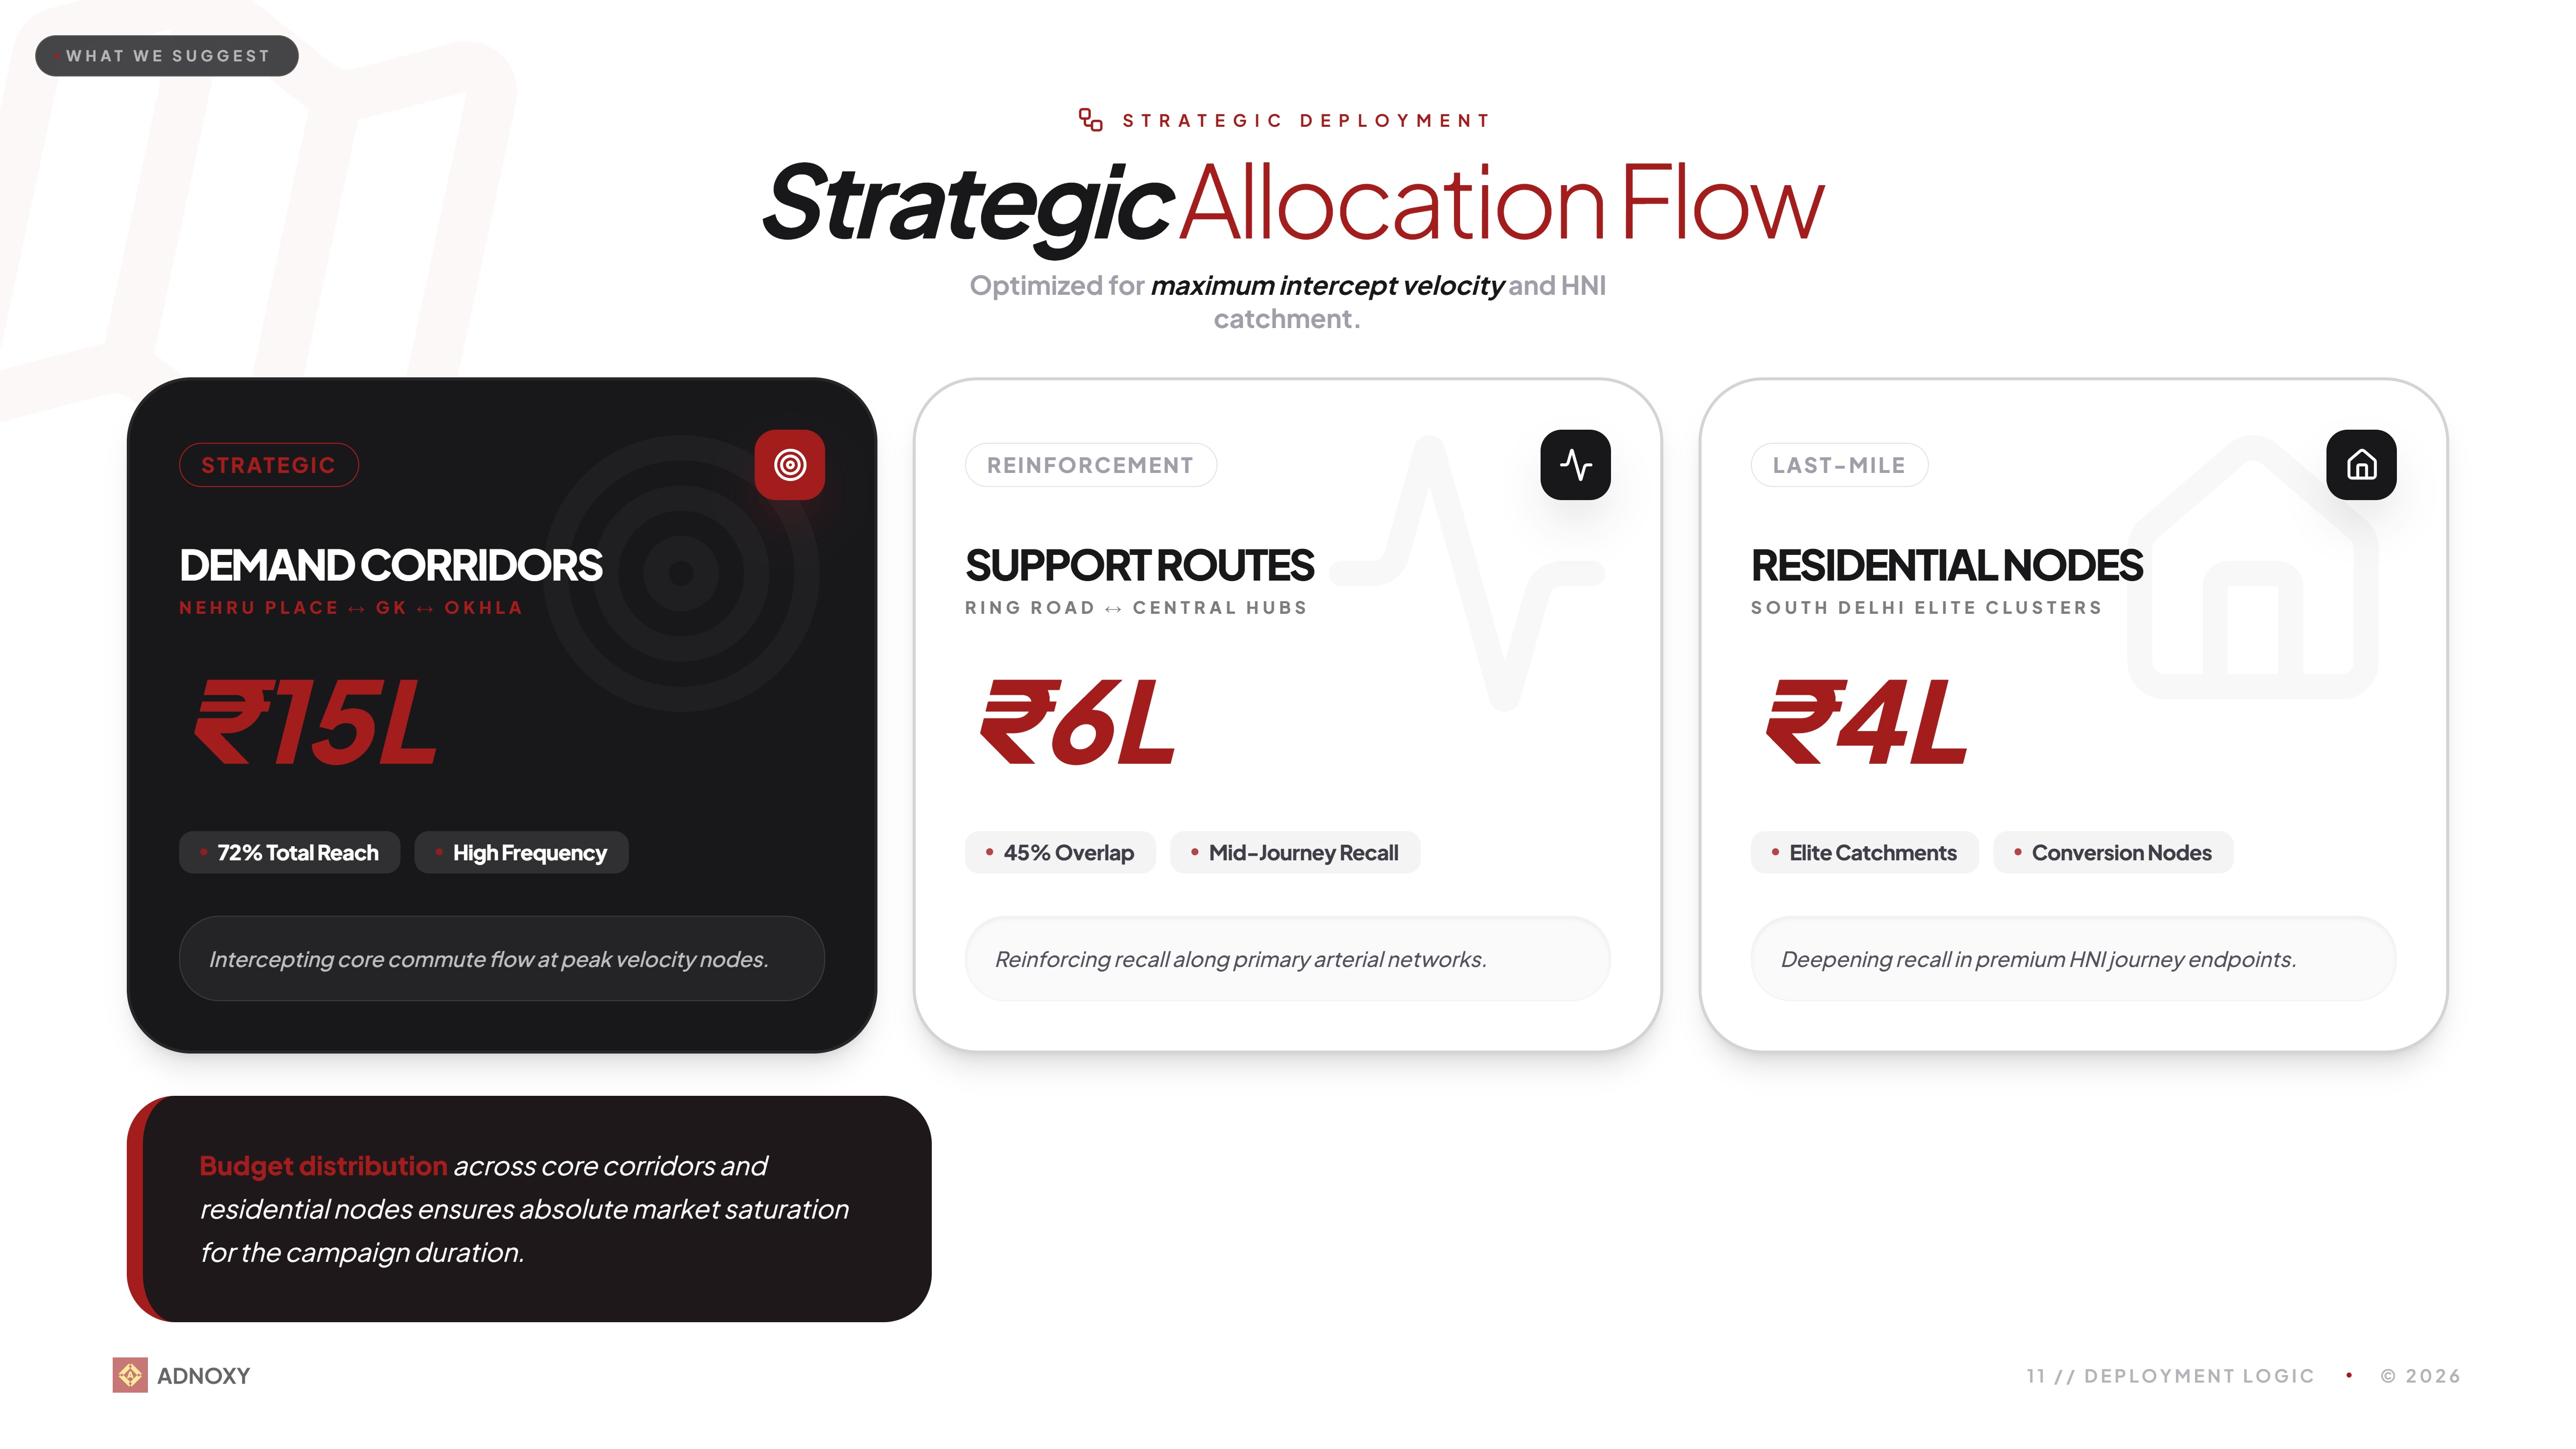
Budget followed movement intensity. Not rate card. Not vendor relationship. Not availability.
4 corridors. 13 sites. Over 70% of total elite demand capture within budget.
The allocation structure: ₹15L to high-frequency primary corridors. ₹6L to mid-journey support routes. ₹4L to last-mile elite residential catchments.
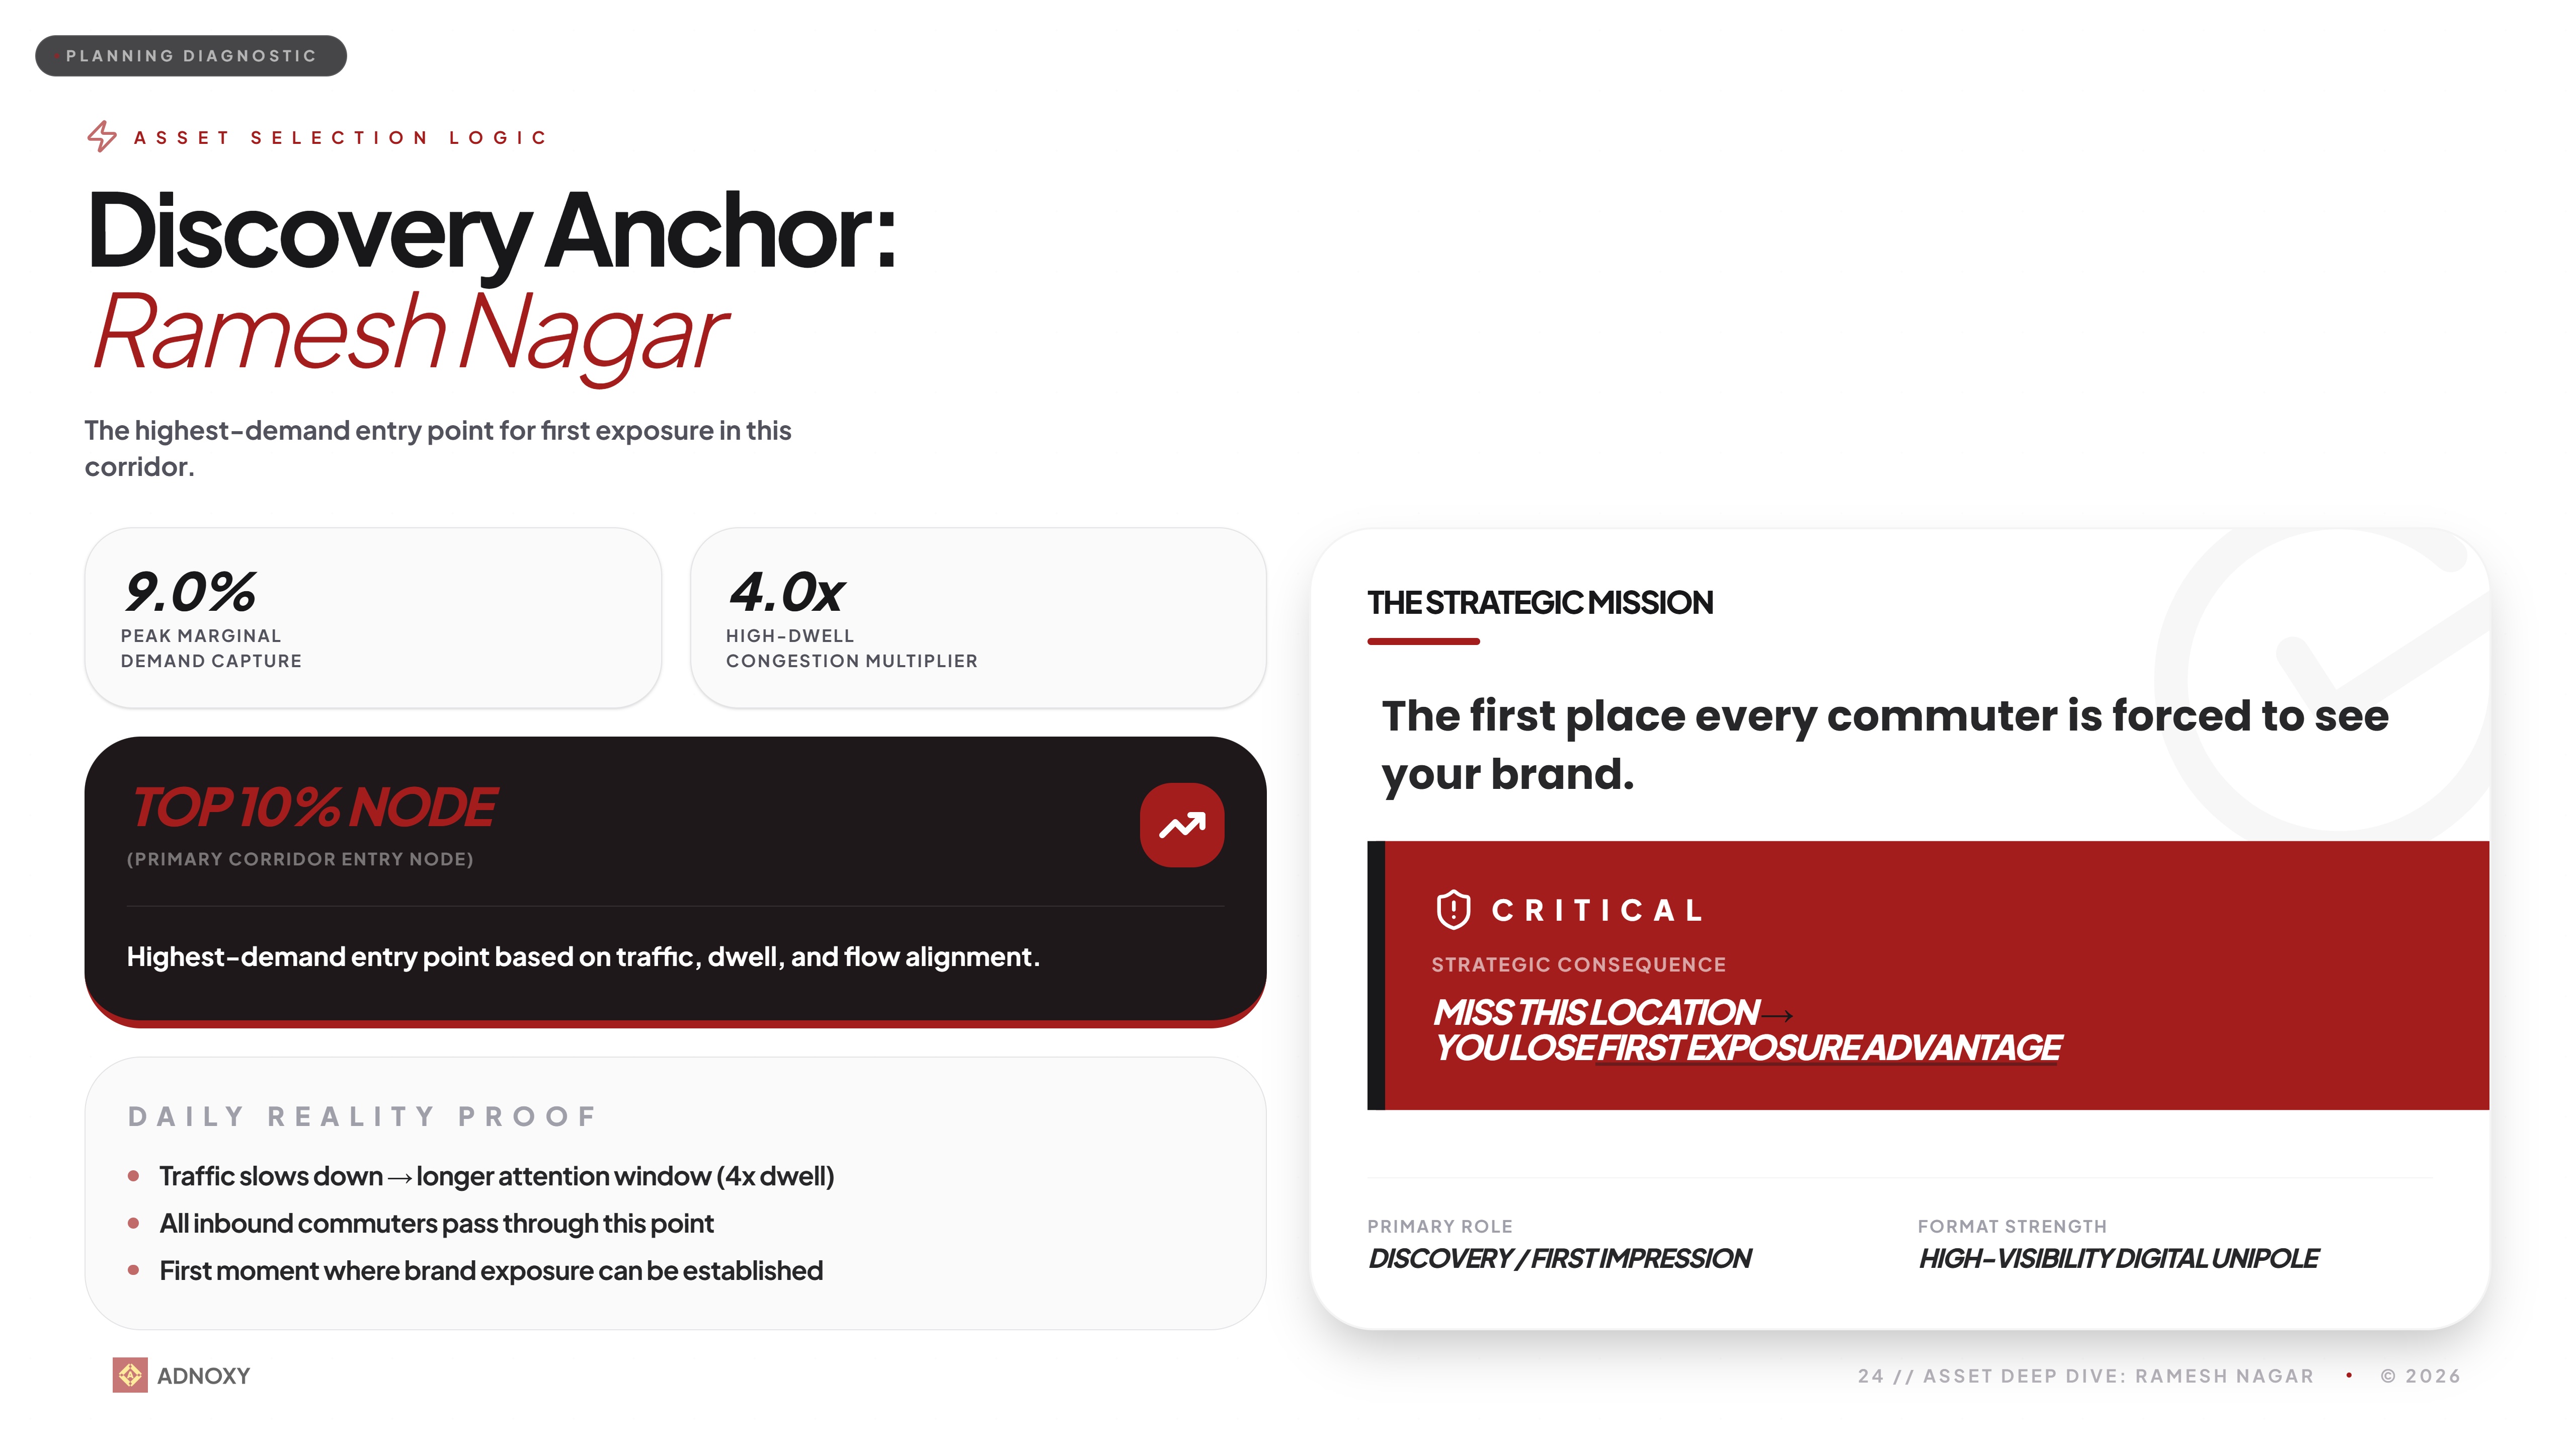
Ramesh Nagar Hub.
Location selected due to flow mechanics that produce a localized density anomaly.
A downstream road bottleneck forces vehicles into a reduced-velocity loop. Commuter dwell is extended at the site, increasing message exposure time relative to raw passage velocity.
96 points of interest within the immediate micro-zone. Finance. F&B. Retail. All indicators of a high-commercial-activity node where the audience pauses, not passes.
Network-Level Impact
- ■13 audited sites across 4 confirmed corridors.
- ■2.8M+ weekly corridor exposure.
- ■~72,000 individual commuters intercepted 3-5× daily.
- ■1.8× more HNI impressions recorded relative to standard general city deployment models.
70%+ of total elite demand capture within a ₹25L budget.
The typical OOH plan delivered to a real estate developer:
× No residential mapping.
× No employment topology.
× No movement corridor analysis.
× No demand scoring.
× No rejection documentation.
× No timing psychology.
× No sequential frequency design.
× No asset-level traffic physics.
Need a plan built
from the ground up?_
Share your brief. We'll architect a city-wide deployment strategy from scratch — audience mapping, corridor selection, and budget allocation, all backed by movement data.
Not a list of sites. A structured plan.
Audience mapping. Corridor architecture. Budget allocation. Full deployment strategy.